Polkadot price on the verge of recovery as DOT prepares for 15% jump
- Polkadot is on the path to recovery after the correction at the beginning of this week.
- Upside looks limited with a double technical resistance at $31.76.
- Once that is cleared, buyers have an incentive to go to $37.02.

Polkadot (DOT) has not been the easiest of cryptocurrencies for buyers to look for good entry levels for a long. The buy-the-dip strategy was complicated as no fundamental entry levels offered themselves. On September 7, the price action just above the 55-day Simple Moving Average (SMA) looked nice, but not many buyers will have dared to catch a falling knife around $22.
Polkadot buyers can plant their flag back above $32.50
The false break at $29.12 on September 8 will probably have tricked a few buyers into a bull trap, and they never saw any positive P&L on their entry that day. Only the genuinely patient buyers with a strict plan will have had the guts and wide stop to stay in the trade and lived to die another day. Experienced traders will have waited another day for the dust to settle further and will have loved the entry or fade-in between the monthly pivot at $26.64 and $27.22. Price action bounced off perfectly from those levels.
The body of the candle got supported by the 200-day SMA at $27.81. This gave buyers three solid reasons to get in as price action looked healthy and more logical after the swings from previous days.
Buyers already tried to reclaim the $31.76 barrier and the green ascending trend line from July 20, but they failed at their first attempt. A second attempt looks to be unfolding today with price action firmly above $29.12, and during the Asian session an attack above $31.76 already occurred. It is now vital for DOT to be able to close the week above there.
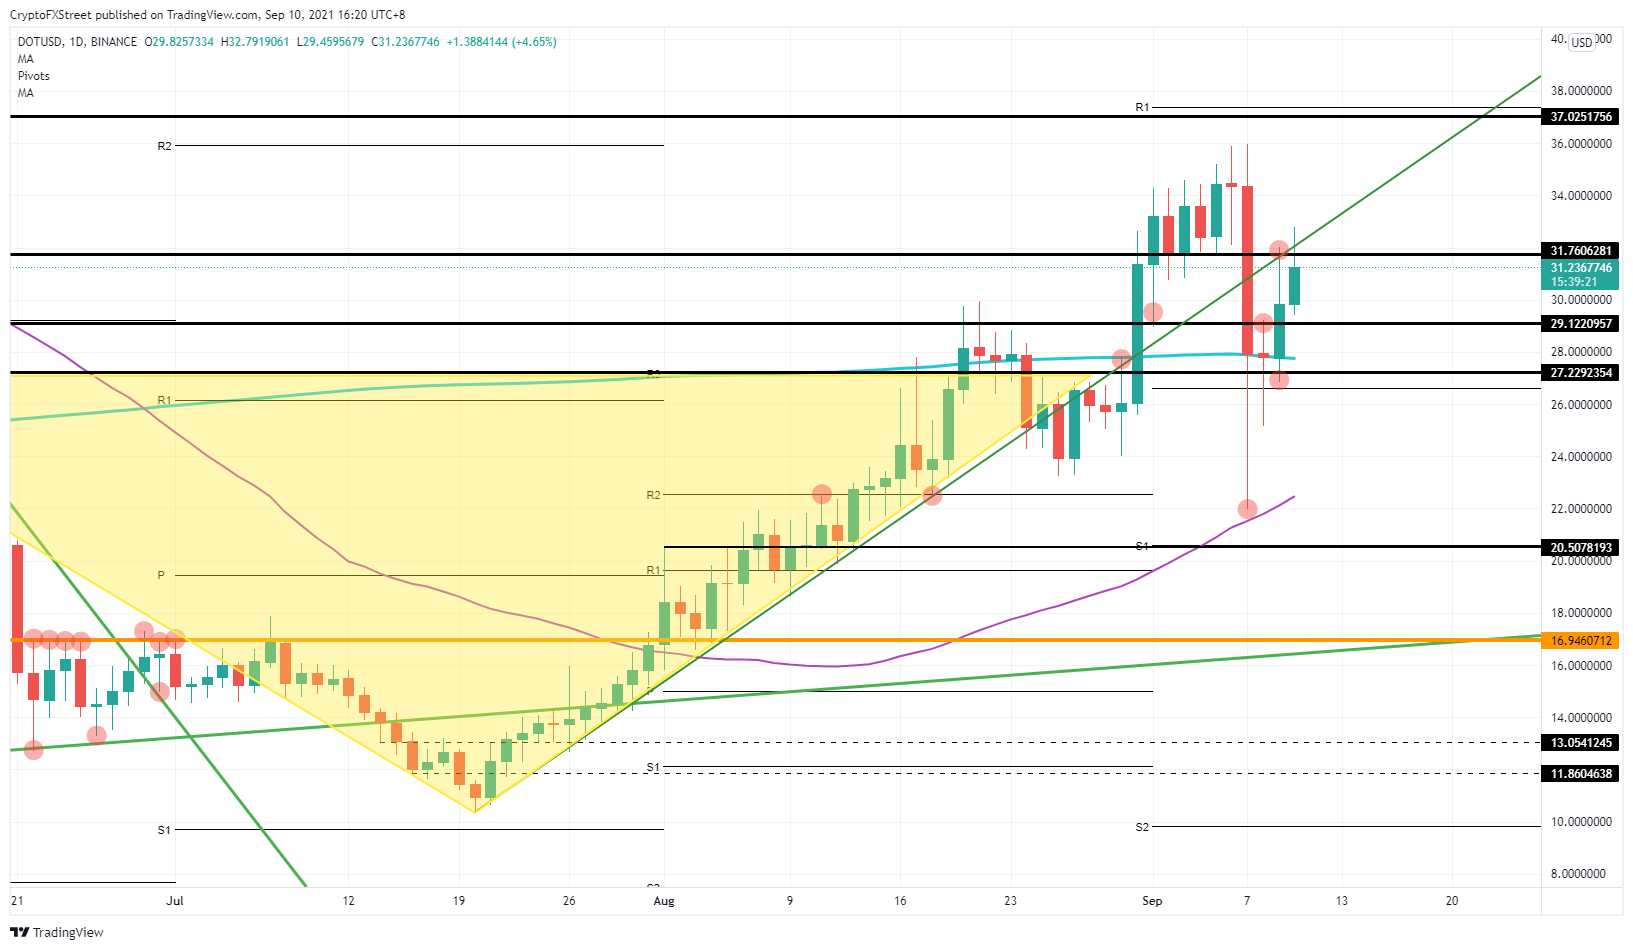
DOT/USD daily chart
Expect a possible retest at $29.12. That level should hold within the uptrend. Favorable tailwinds from global markets returning to risk-on should help additional buyers to step into DOT. Once price action can jump above $32.50, expect further upside. By the end of the US session, a close above there would mean further upside next week toward a retest of $37.02.
Author

Filip Lagaart
FXStreet
Filip Lagaart is a former sales/trader with over 15 years of financial markets expertise under its belt.



