- Polkadot price could soon retest the $5.94 to $6.51 demand zone before a quick run-up.
- Investors can expect DOT to rally 20% in an upswing to $7.77, possibly even to $9.65.
- A daily candlestick close below $5.94 will invalidate the bullish thesis for DOT.
Polkadot price is approaching an inflection point that could potentially reverse the downtrend and allow bulls to take control. This development comes as BTC is also attempting to find a stable support level to kick-start its recovery rally, making a bullish outlook more likely for DOT too.
Polkadot price searches for stable footing
Polkadot price has crashed roughly 29% since August 10, allowing it to retest the range low at $6.85. So far, this level seems to be holding up pretty well, and if buyers step in, a reversal might occur from the current position at $6.94.
However, the ideal scenario would be for Polkadot price to fall a little more, tagging the $5.94 to $6.51 demand zone. Due to the imbalance here, it’s a good place for investors to expect a bullish momentum spike that pushes DOT to kick-start an uptrend.
The equal highs formed at $7.77 would be the first target for Polkadot bulls, but penetration and subsequent flipping of the level into a support floor will allow buyers to extend the run-up to the next equal high formed at $9.65. This move could constitute a 48% gain when measured from $6.51 and is likely where the local top will form.
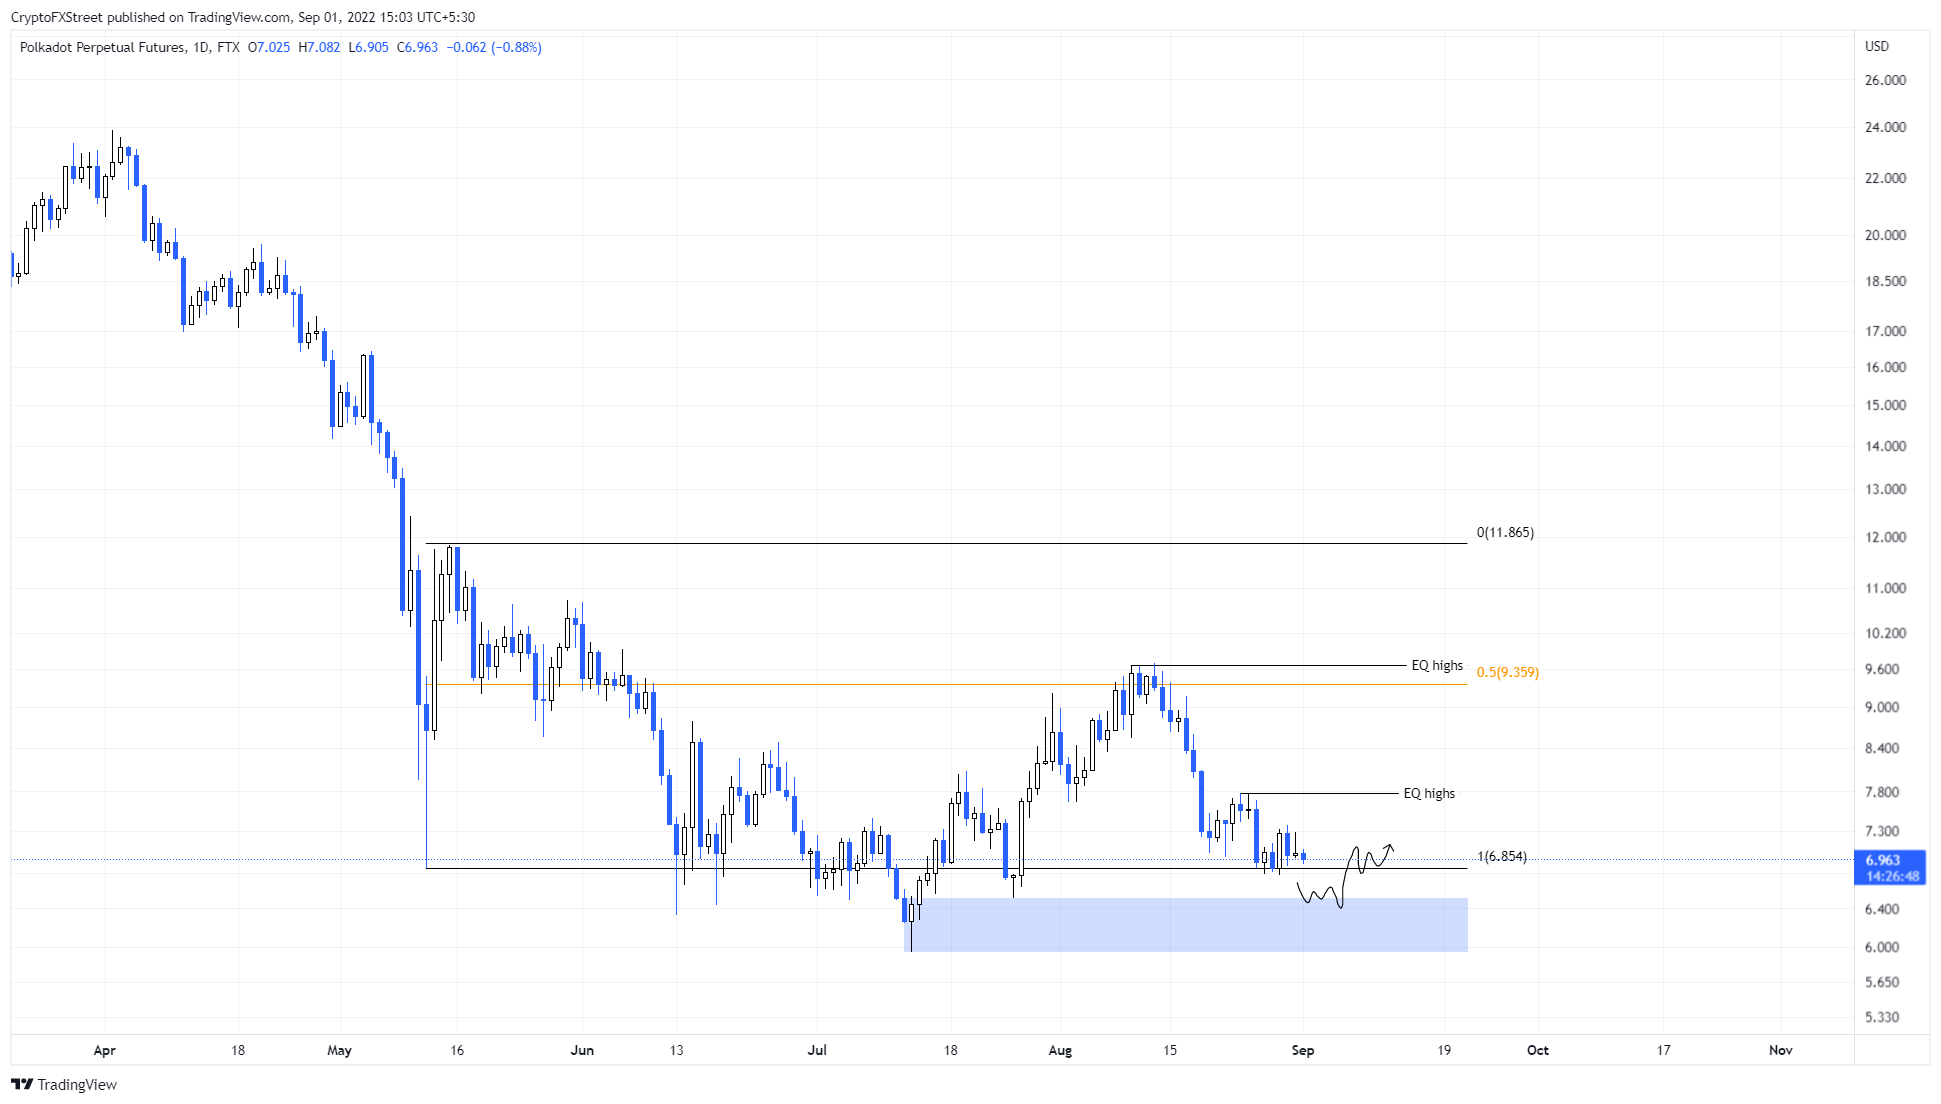
DOT/USDT 1-day chart
On the other hand, if the buyers fail to make a comeback when Polkadot price dips into the $5.94 to $6.51 demand zone, it will indicate a dearth of bullish momentum. This unfortunate development could cause DOT to produce a daily candlestick close below $5.94, which would invalidate the bullish thesis by creating a lower low.
In such a case, Polkadot price might revisit $5.50 and the $5 psychological levels in search of key support.
Note:
A reversal in Bitcoin price could see altcoins do the same, and the video attached below details a potential short-term recovery rally for BTC.
Information on these pages contains forward-looking statements that involve risks and uncertainties. Markets and instruments profiled on this page are for informational purposes only and should not in any way come across as a recommendation to buy or sell in these assets. You should do your own thorough research before making any investment decisions. FXStreet does not in any way guarantee that this information is free from mistakes, errors, or material misstatements. It also does not guarantee that this information is of a timely nature. Investing in Open Markets involves a great deal of risk, including the loss of all or a portion of your investment, as well as emotional distress. All risks, losses and costs associated with investing, including total loss of principal, are your responsibility. The views and opinions expressed in this article are those of the authors and do not necessarily reflect the official policy or position of FXStreet nor its advertisers. The author will not be held responsible for information that is found at the end of links posted on this page.
If not otherwise explicitly mentioned in the body of the article, at the time of writing, the author has no position in any stock mentioned in this article and no business relationship with any company mentioned. The author has not received compensation for writing this article, other than from FXStreet.
FXStreet and the author do not provide personalized recommendations. The author makes no representations as to the accuracy, completeness, or suitability of this information. FXStreet and the author will not be liable for any errors, omissions or any losses, injuries or damages arising from this information and its display or use. Errors and omissions excepted.
The author and FXStreet are not registered investment advisors and nothing in this article is intended to be investment advice.
Recommended Content
Editors’ Picks
Ripple's move above this key level could trigger nearly 50% rally for XRP
Ripple has overcome a critical resistance level and flipped into a support floor on the weekly time frame. This development happened while XRP tightly consolidated for roughly 250 days. Investors can expect XRP to kickstart a massive rally.
Optimism price outlook with nearly $90 million worth of OP tokens flooding markets on Friday
Optimism volatility has shrunk in the ours leading to the network’s cliff unlock. It joins the likes of dYdX and Sui, which have similar events on their calendars. As token unlocks are often considered bearish catalysts, investors should brace for a reaction after the event.
Top 3 Price Prediction Bitcoin, Ethereum, Ripple: Retail watches from the sidelines with a bias for shorts
Bitcoin could clear $73,777 peak as BTC bulls resurface. Ethereum might fall 10% before next leg up as ETH RSI teases with sell signal. XRP could lose $0.6000 threshold as Ripple bulls fail to show up.
Jito price could hit $6 as JTO coils up inside this bullish pattern
Jito price action shows a potential cup and handle formation. Based on theoretical measurement rules, a successful breakout could yield a 56% rally to $6.0. A breakdown of the $3.86 support level would create a lower low for JTO and invalidate the bullish thesis.
Bitcoin: BTC may have recovered, but is it out of the woods?
Bitcoin’s (BTC) upward momentum has shown a significant decline for the past two weeks or so. This development led to a bearish signal on the weekly and an uncertain outlook on the monthly.