Polkadot Price Prediction: DOT hints at minor retracement before resuming its rally
- Polkadot price faced rejection as it pierced the supply zone that extends from $42 to $44.06.
- The MRI has flashed a cycle top signal, indicating that DOT might experience a corrective phase.
- This correction could be dampened by the demand barrier that ranges from $37.90 to $41.

Polkadot price shows a slowdown in its bullish momentum that has resulted in sellers taking over. Now, a minor retracement could push DOT into a significant support barrier.
Polkadot price halts midway to establish a new trend
On the 6-hour chart, Polkadot price showed a substantial 22% upswing that pushed it into a supply zone that extends from $42 to $44.06. However, the sellers overwhelmed the buyers, which is causing DOT to slide lower.
Contributing to this descent is the Momentum Reversal Indicator (MRI)’s cycle top signal in the form of a red ‘one’ candlestick, which forecasts a one-to-four candlestick correction.
Going forward, investors can expect Polkadot price to dip into the demand zone that extends from $37.98 to $41.
If DOT stays inside the ranges mentioned above, it is more than likely to continue its uptrend and take another jab at the supply barrier. A successful build of buying pressure will quickly propel Polkadot price up by 20% to retest its all-time high at $48.36.
The resistance level at $45.49 might hinder the upswing. Therefore, investors need to keep a close eye on it.
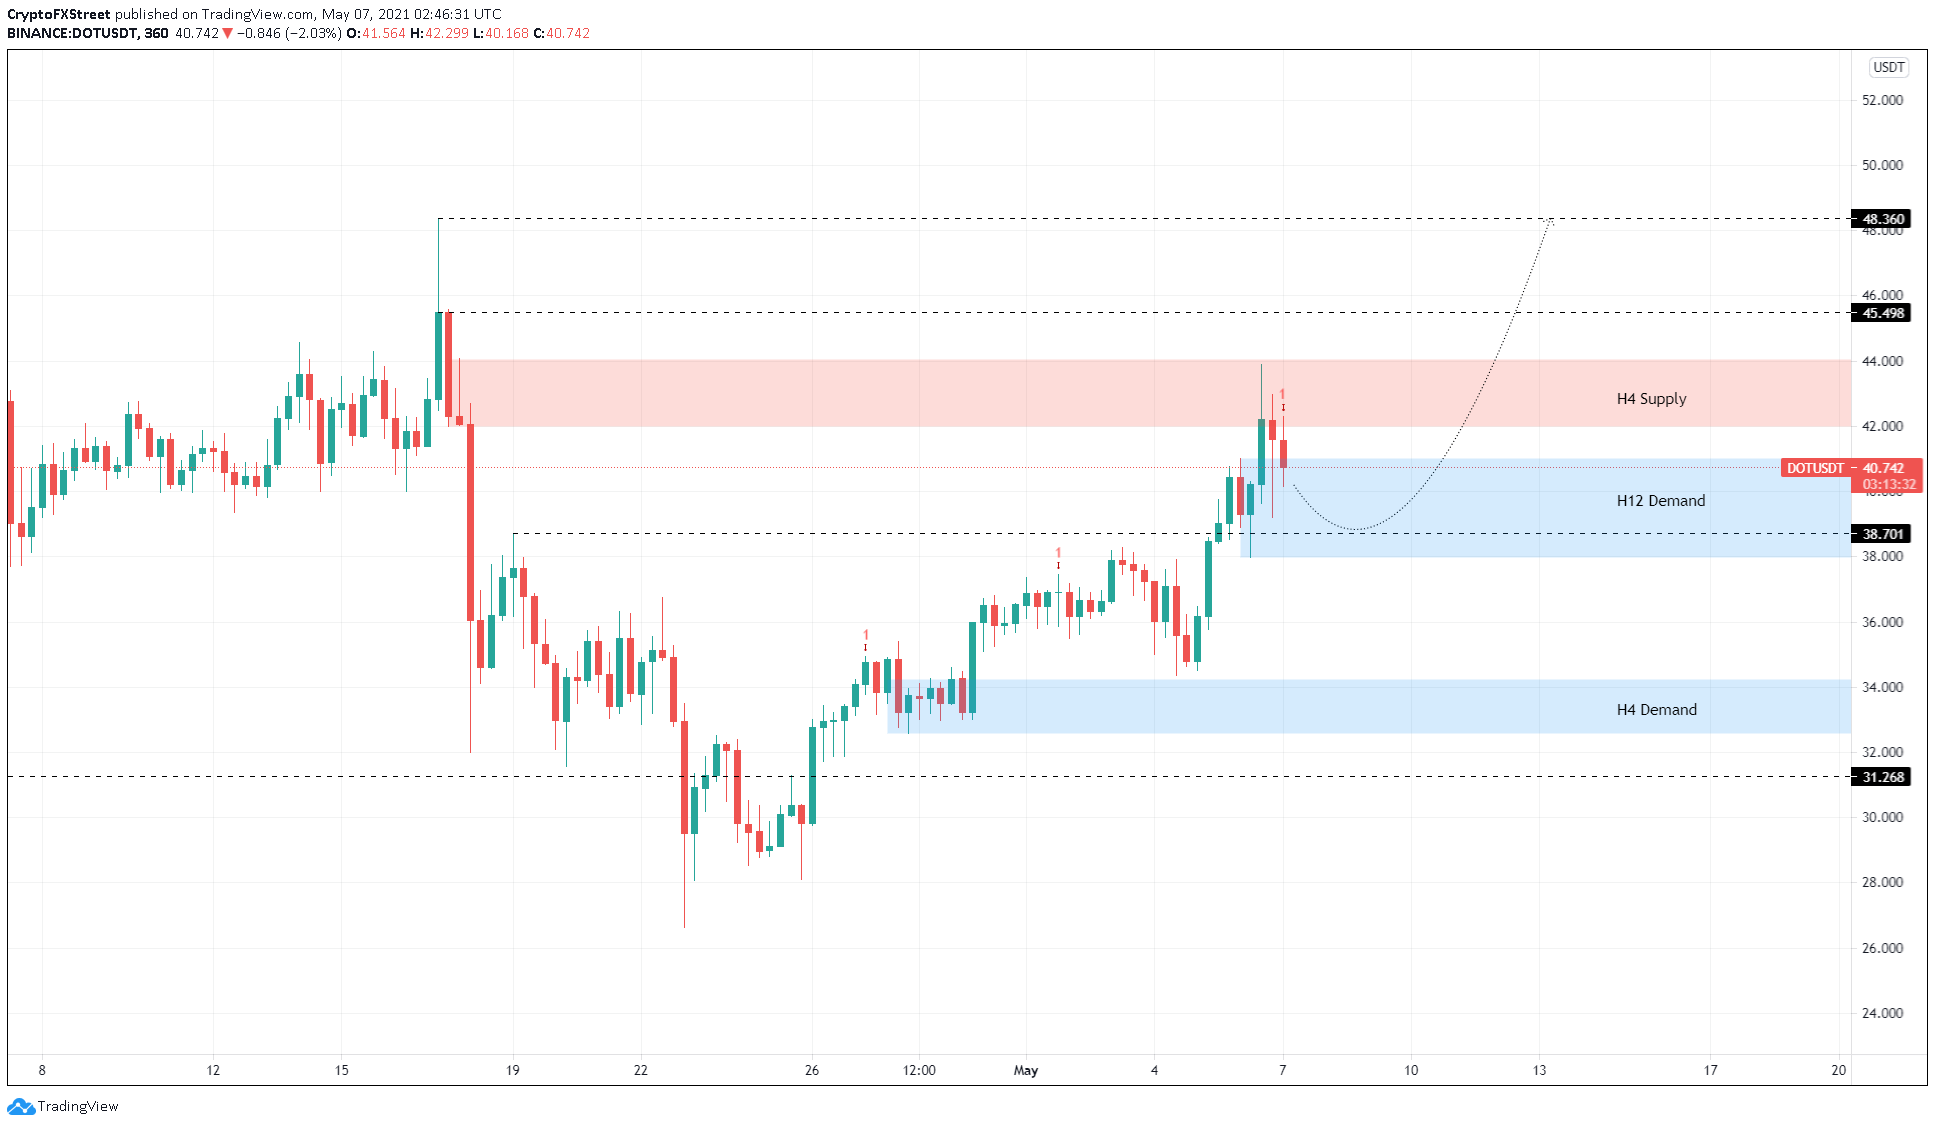
DOT/USDT 6-hour chart
The first sign of weakness will be seen when Polkadot price slices through $38.70. A breakdown of the demand zone’s lower boundary at $37.98 will invalidate the bullish scenario and lead to a minor retracement to $36.50.
If the selling pressure continues, market participants can expect the DeFi coin to slide toward the next demand barrier’s upper trend line at $34.25.
Author

Akash Girimath
FXStreet
Akash Girimath is a Mechanical Engineer interested in the chaos of the financial markets. Trying to make sense of this convoluted yet fascinating space, he switched his engineering job to become a crypto reporter and analyst.



