Polkadot Price Prediction: DOT coils up for a possible 10% pounce
- Polkadot price seems to have found an inflection point after a rejection from the supply barrier extending from $7.236 to $7.575.
- DOT could recover 10%, flipping the supply zone into a bullish breaker above its upper boundary at $7.575.
- Invalidation of the bullish thesis would occur after a decisive candlestick close below $6.240.

Polkadot (DOT) price continues to endure the strong seller presence due to the supply barrier extending from $7.236 to $7.575. The initial confrontation saw the altcoin rejected nearly 12% and now the bulls may be pushing for a second attempt at this supplier congestion zone.
Also Read: DOT 80% recovery rally nabbed as Polkadot price meets critical supply barrier
Polkadot could rally 10%
Polkadot (DOT) price has found support due to the 25-day Exponential Moving Average (EMA) at $6.387 after a 12% rejection from the supply barrier. Based on the outlook of the Relative Strength Index (RSI), the bulls could be attempting a do-over as this momentum indicator has deviated from an initial southbound move, attempting to pull north.
Increased buyer momentum could see Polkadot price recover the lost ground, confirming the continuation of the uptrend by breaking and closing above the midline of the supply zone at $7.396. Further north, the price could flip the supply barrier into a bullish breaker, confirmed by a move to the range high at $7.900. A move to the upper boundary of the supply zone at $7.575 would constitute a 10% climb above current levels.
In a highly bullish case, Polkadot price could extend a neck higher to tag the $8.000 psychological level, in a move that would denote an 18% climb above current levels.
Notably, with both the Awesome Oscillator (AO) and the Moving Average Convergence Divergence (MACD) indicators still in the positive territory, the odds still favor the upside.
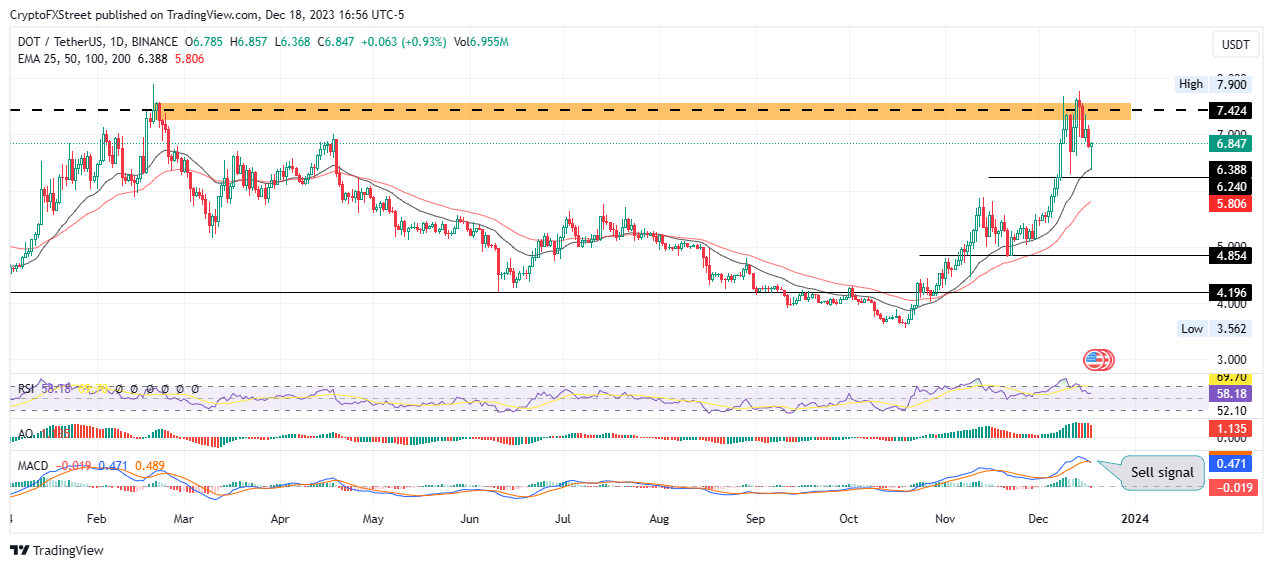
DOT/USDT 1-day chart
Nevertheless, the MACD has triggered a sell signal, marked by the crossover where the MACD line crosses below the signal line. Traders heeding this call could spell doom for Polkadot price. The AO also shows that the bears are steadily gaining ground, evidenced by the red histogram bars that are edging towards the zero line.
Increased selling pressure could see Polkadot price lose the support due to the 25-day EMA, extending the fall to the $6.240 support level. A daily candlestick close below this level would invalidate the bullish thesis.
In the dire case, Polkadot price could extend the fall to test the 50-day EMA at $5.806, or worse, slipping past this level to target the $4.854 support. This would denote a 29% drop below current levels.
Author

Lockridge Okoth
FXStreet
Lockridge is a believer in the transformative power of crypto and the blockchain industry.



