|

Polkadot Price Prediction: A pullback followed by a stronger decline

  • Polkadot price has been rejected from two moving averages,
  • DOT shows an influx of volume transactions as the price descends.
  • Invalidation of bearish outlook thesis is a breach above $8.00

Polkadot price seems on its way toward newfound lows. Key levels have been defined.

Polkadot price shows bearish stregnth

Polkadot price continues to show reasons to believe that a sweep-the-lows event is underway. DOT, The cutting-edge smart contract and gaming token, experienced a 24% decrease last month after breaching an ascending trend line. The trend line supported the summer as prices fluctuated back and forth in a triangular fashion. An influx of volume was spotted during the most recent sell-off, which looks like a continuation pattern compared to previous sell-offs. 

Polkadot price currently auctions at $6.30 as the bulls have been rejected from both the 8-day exponential and 21-day simple moving averages. The Relative Strength Index is back above support on larger timeframes showing the current sell-off may be short-lived. A pullback near $7.00 is plausible in the days to come.

Still, the triangular breach could result in a serious sell-off in the grand scheme. If the technicals are correct, a liquidation towards the $3.50 level could occur sometime in 2023. Such a decline would result in a 40% decrease from the current market value. 
tm/dpt/10/7/22

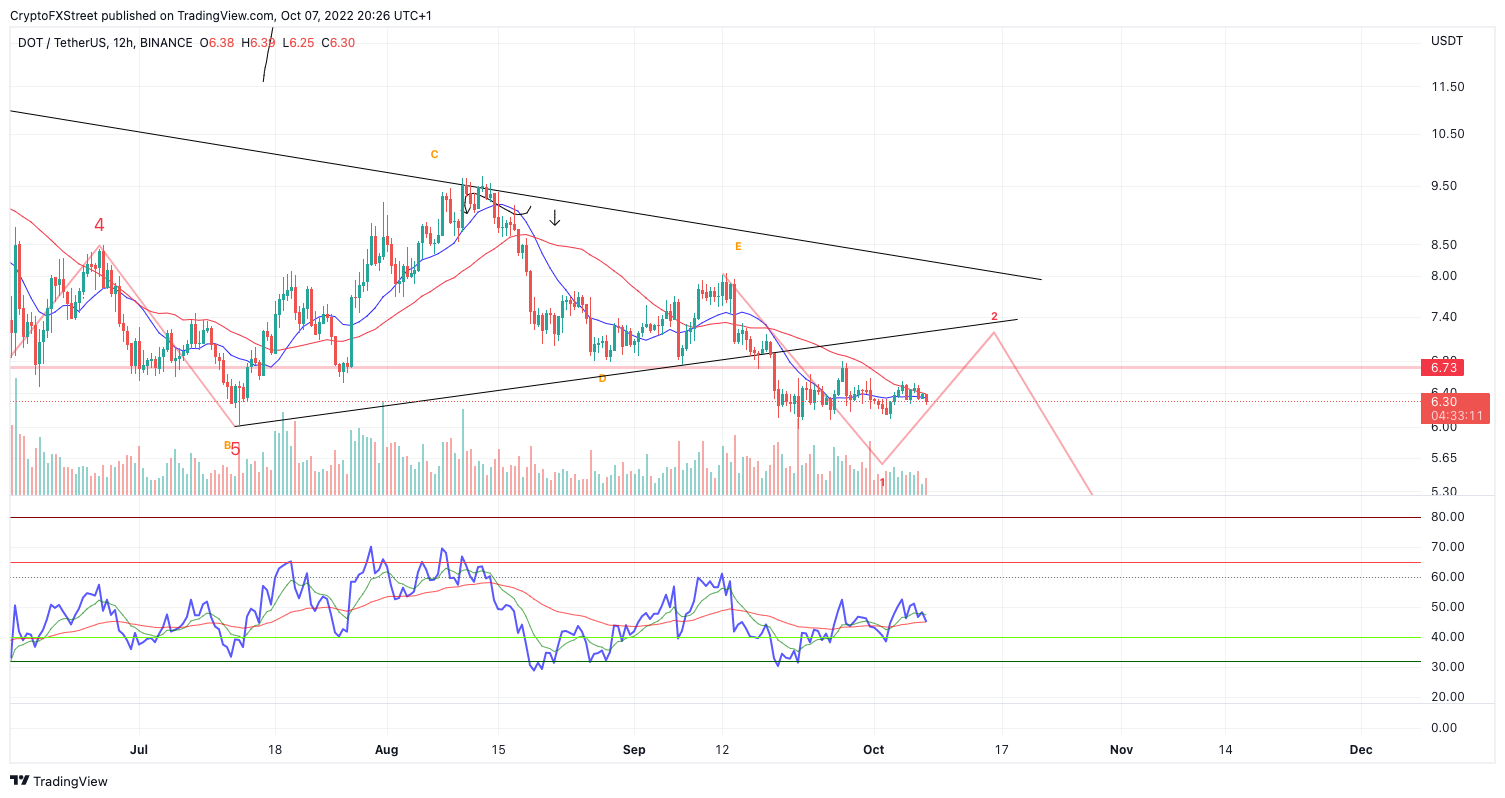
DOT USDT 12-Hour Chart

Invalidation of the bearish thesis is a breach of the September 12 $8,00 swing high. If the breach occurs, an additional uptrend rally targeting $10 could occur, resulting in an 85% increase from the current Polkadot price.

In the following video, our analysts deep dive into the price action of Polkadot, analyzing key levels of interest in the market. -FXStreet Team

Author

Tony M.

Tony M.

FXStreet Contributor

Tony Montpeirous began investing in cryptocurrencies in 2017. His trading style incorporates Elliot Wave, Auction Market Theory, Fibonacci and price action as the cornerstone of his technical analysis.

More from Tony M.
Share:

Editor's Picks

Ethereum Price Forecast: Long-term holders' capitulation drives ETH below $1,800

Ethereum has fallen below $1,800 on Wednesday, the first time since May 2025 following accelerated spot selling pressure and distributions from long-term holders.

XRP and XLM outlook: Bearish streak extends as risk-off mood erodes retail demand, ETF flows

Ripple and Stellar prices face intense selling pressure, extending losses on Thursday for the fourth consecutive day this week. Cross-border remittance tokens are losing retail sentiment, while XRP faces additional pressure from Exchange-Traded Fund outflows. 

Bitcoin drops below $65K amid reinforced bear market signals

Bitcoin dipped further below $65,000 with onchain data from Glassnode signaling a market firmly in a bear phase. The decline has pushed prices back into a key valuation range between the Realized Price and the True Market Mean.

Grayscale launches Hyperliquid staking ETF, undercutting rival fees

Grayscale announced the launch of its Hyperliquid Staking ETF (HYPG) on Wednesday, now trading on Nasdaq. The fund offers investors direct exposure to HYPE and incorporates staking rewards, which the company claims have historically ranged from 2.2% to 2.3% annually.

Billions in ETF outflows don’t bode well
Bitcoin (BTC) remains under pressure, trading below $74,000 on Friday, and is set to post its third consecutive week of losses. The institutional sell-off continues, with spot BTC Exchange-Traded funds (ETFs) recording billions in outflows. In addition, sticky inflation and macroeconomic headwinds suppress the Crypto King’s upside potential. Institutional demand continues to weaken so far this week.