Polkadot Price Prediction: A 12% decline in the making?
- Polkadot price lost 10% of its market value last week.
- DOT shows a strong potential to decline toward the $5.36 level.
- Invalidation of the bearish thesis would arise from a break above $7.04.

Polkadot price shows short-term bearish bias within an uptrend rally that began in the winter of 2023. Traders should keep their eyes open for any sudden changes to market behavior and manage risk accordingly while trading the Polkadot price.
Polkadot price due for a pullback
Polkadot price witnessed the steepest decline of 2023 as the innovative smart contract token declined by 10% last week. The strongest red day ocurred on February 25 as the bearish produced a 5% downswing in just 24 hours. At the time of writing, the DOT token remains suppressed under the strongest candles' closing price at $6.61, which hints that more decline is possible in the future.
Polkadot price currently auctions at $6.72. On February 27, the bulls tried reconquering the 21-day simple moving average (SMA) as support but were rejected during the New York session. A Fibonacci retracement tool surrounding Polkadot’s 80% winter rally since January 1 shows the recent decline as a shallow pullback in the grand scheme of things.
Based on Fibonacci analysis, DOT could continue declining towards the 61.8% golden pocket zone near $5.36. The bearish scenario would create the potential for a 13% decline from DOT's current trading price.
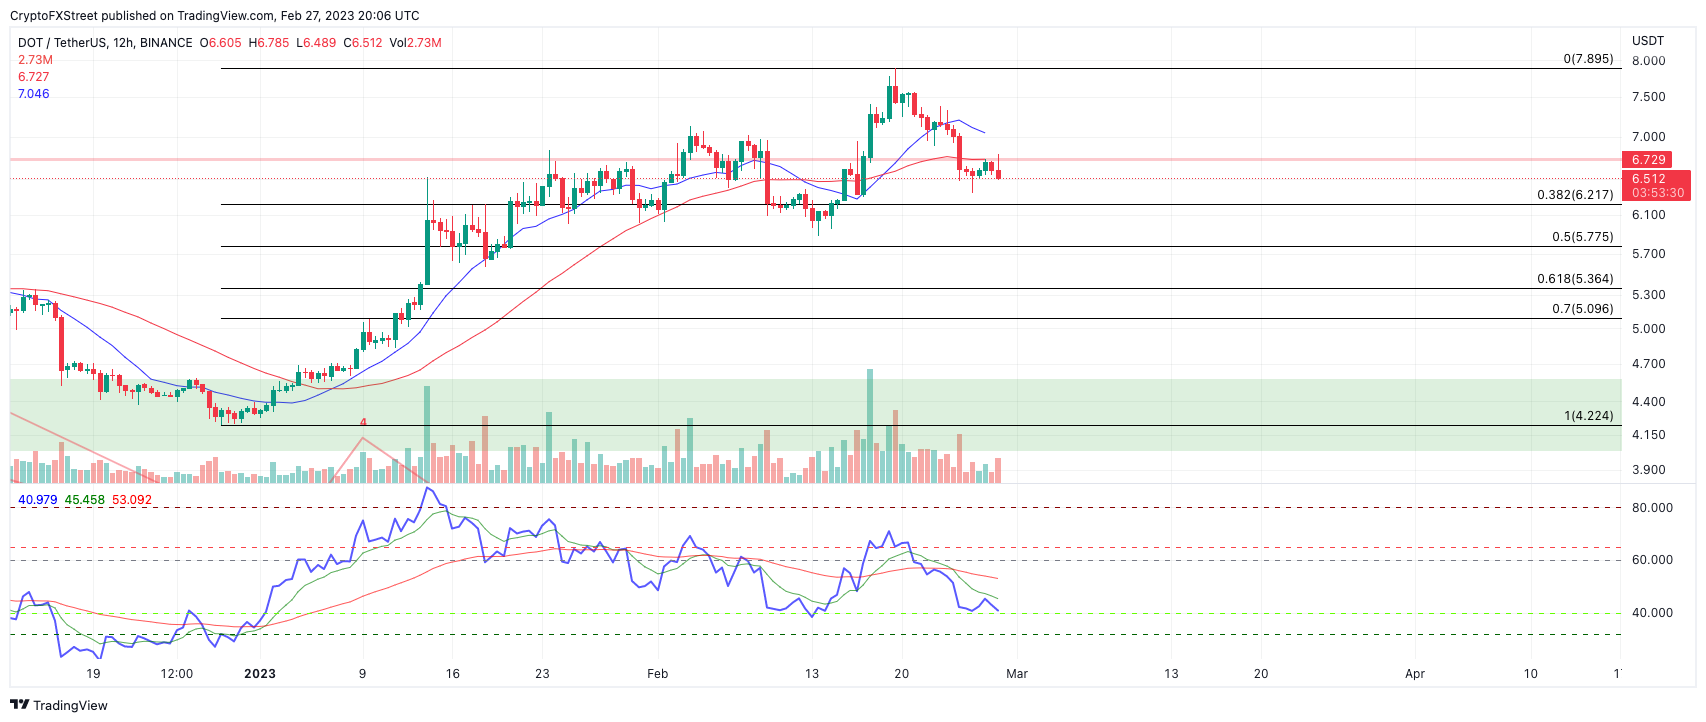
Invalidation of the bearish thesis would arise from a February 25 daily high break of the February 25 daily high at $7.04. A barrier breach would suggest that the winter rally is on pace to continue. A second retest of February’s monthly high would be the first pit-stop for the Polkadot price, resulting in a 20% incline from DOT's current market value.
Author

Tony M.
FXStreet Contributor
Tony Montpeirous began investing in cryptocurrencies in 2017. His trading style incorporates Elliot Wave, Auction Market Theory, Fibonacci and price action as the cornerstone of his technical analysis.


