Polkadot price looks to climb 25% despite US congressman call to shutdown cryptos
- Polkadot price is trading at $15.37, a crucial swing low that might get broken.
- A dip into the demand zone, ranging from $14.06 to $14.49, could propel DOT by 25% to $18.42.
- If the bears shatter the support level at $13.65, the bullish thesis will face invalidation.

Polkadot price has seen a massive downtrend between June 20 and 22, which created a new range low. While many altcoins have already undone the said correction, DOT has not.
Therefore, investors can expect a volatile move, especially if it bounces from a critical demand zone.
Congressman talks about shutting down cryptocurrencies
While Bitcoin adoption has taken off, some US congressmen are still trying to control digital assets. Brad Sherman (D-CA) is one such politician who called for a shutdown of digital assets in a hearing on June 30.
The representative mentioned how one person making a million dollars would lead “nine others [to] not retire in dignity but instead become eligible for Medicaid.”
The elected leader added, “I hope we shut it down.”
Sherman further mentioned that cryptocurrencies are used to “circumvent KYC” and are supported by “anarchists who are rooting for tax evasion.”
Even to this day, many politicians still lack a clear understanding of Bitcoin, blockchain or Ethereum and call for a ban or other stern approaches.
However, institutions are already scrambling to leverage the hype and offer customers a portal to invest in digital assets.
Polkadot price eyes a higher high
Polkadot price has seen four failed attempts to breach the 50% Fibonacci retracement level around $17 over the past week. The latest jab saw a violent rejection that led to a 7% downswing.
This correction might continue until DOT finds stable support at the demand zone, ranging from $14.06 to $14.49. In some cases, Polkadot price might even dip below the said barrier and reverse after bouncing from the support level at $13.65.
The upswing that emerges from $13.65 will likely push DOT to take another try at crossing the 50% Fibonacci retracement level around $17. If the bullish momentum is enough, Polkadot price might slice through it effortlessly.
In such a case, the altcoin might eye a retest of the resistance barrier at $18.42. Although unlikely, if the bid orders continue to pile up here, DOT might retest the range high at $21.
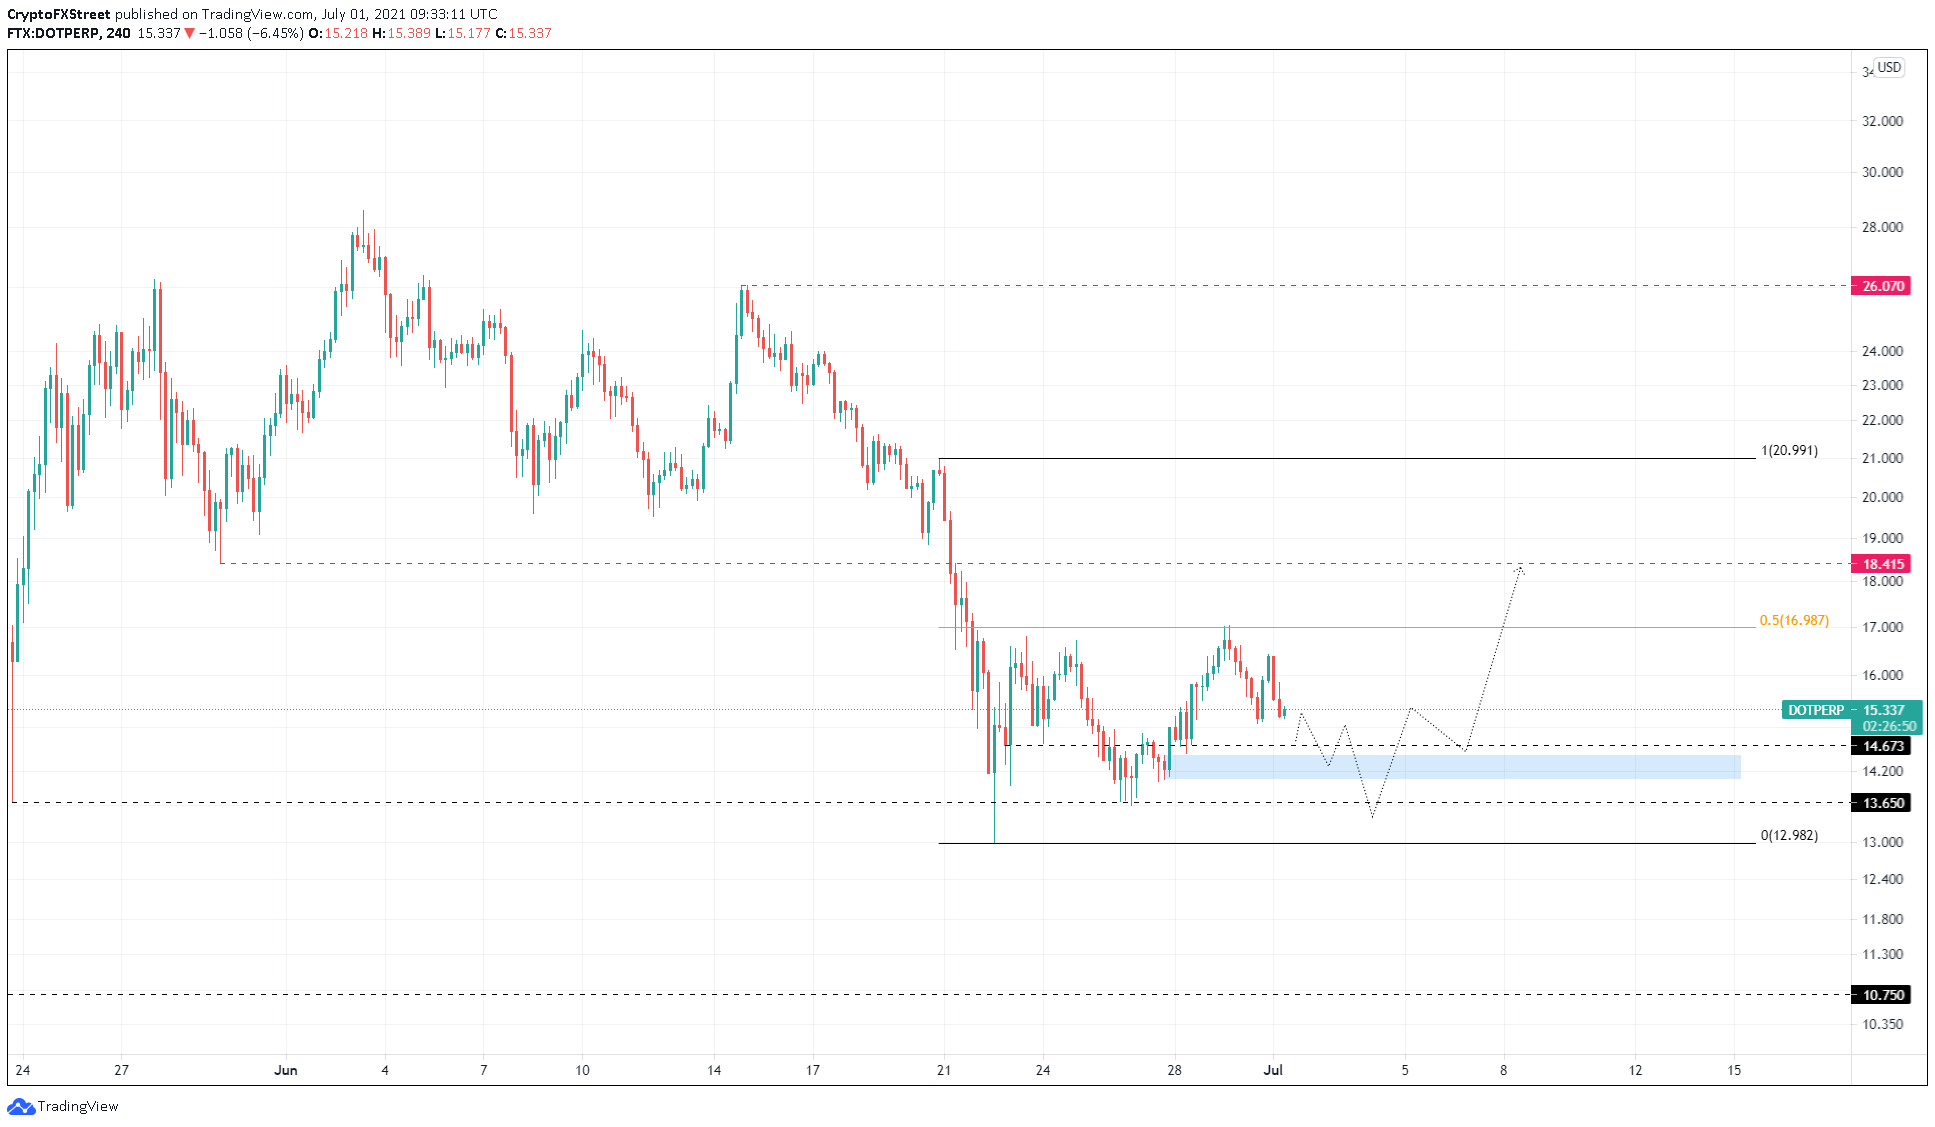
DOT/USDT 4-hour chart
On the other hand, if Polkadot price slices through the support barrier at $13.65, it will signal the presence of sellers, who might further drag the altcoin down to the range low at $12.98.
A breakdown of this support level will invalidate the bullish thesis and result in a 17% sell-off to the next demand barrier at $10.75.
Author

Akash Girimath
FXStreet
Akash Girimath is a Mechanical Engineer interested in the chaos of the financial markets. Trying to make sense of this convoluted yet fascinating space, he switched his engineering job to become a crypto reporter and analyst.


