Polkadot Price Forecast: DOT extends gains as bullish pattern points to $6.52 target
- Polkadot price climbs on Friday after retesting the breakout point of a bullish pattern formed earlier this week.
- A fixed supply of 2.1 billion DOT enhances its scarcity appeal, supported by rising open interest and trading volumes.
- The technical outlook favors a continuation of the rally, with the bullish pattern targeting $6.52.

Polkadot (DOT) extends its gains, trading above $4.65 at the time of writing on Friday after successfully retesting a key breakout point earlier this week. A bullish outlook emerges, with scarcity reinforced by DOT’s fixed supply of 2.1 billion, which was announced on Sunday, along with rising open interest and trading volumes. On the technical side, a continuation of the rally is favored, targeting $6.52.
Fixed supply and market activity on the rise suggest a bullish bias
Polkadot community announced on Sunday that Resolution 1710 was passed, with 81% of votes in favor of introducing a “hard cap” on the network’s maximum supply at 2.1 billion.
This announcement is bullish for Polkadot’s native token, DOT, in the long term, as it results in a reduction in annual emissions, supporting key narratives of scarcity and predictability. Previously, Polkadot had an infinite supply model, with the current total supply averaging at 1.522 billion DOT. With the new model, Polkadot’s maximum supply won’t exceed 2.1 billion DOT, with new issuance reducing every two years on March 14 (Pi Day).
Apart from reducing supply, derivatives data also suggest a bullish outlook. CoinGlass futures Open Interest (OI) in Polkadot at exchanges rose from $574.93 million on Tuesday to $685.92 million on Friday, the highest year-to-date (YTD) level since early December 2024. Rising OI represents new or additional money entering the market and new buying, which could fuel the current DOT price rally.
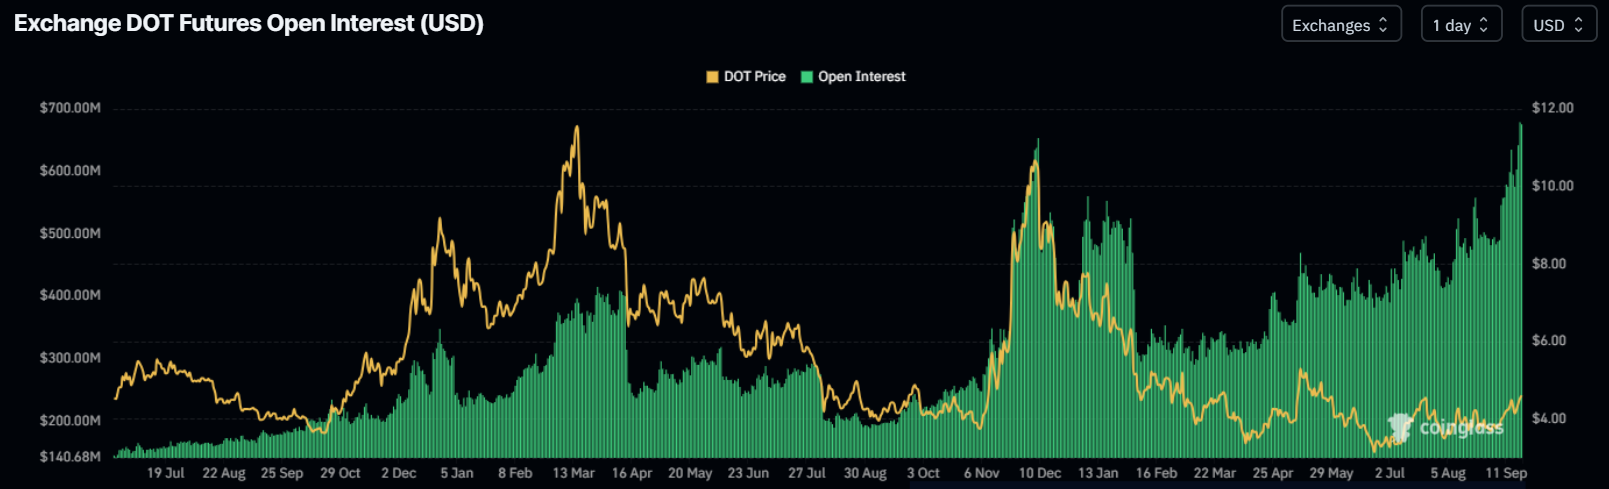
DOT open interest chart Source: CoinGlass
Santiment data indicate that the DOT ecosystem’s trading volume reached 658.34 million on Friday, levels not seen since mid-July. This volume rise indicates a surge in traders’ interest and liquidity in the DOT chain, boosting its bullish outlook.
 [10-1758265336897-1758265336898.32.35, 19 Sep, 2025].png)
DOT trading volume chart. Source: Santiment
Polkadot Price Forecast: Bulls targeting $6.52 mark
Polkadot price broke above the symmetrical triangle pattern, which has been formed by connecting multiple highs and lows with two converging trendlines (from mid-May to mid-September), on September 10 and rallied more than 6% in the next three days. However, DOT failed to maintain its upward momentum and declined on Sunday, retesting its breakout point the following day. DOT rebounded after retesting this breakout point and rose by 9.35% by Thursday. At the time of writing on Friday, it continues to trade higher at around $4.62.
If DOT continues its upward momentum, it could extend the rally toward its technical target at $6.52, extrapolated by the distance between the highest and lowest points of the symmetrical triangle pattern.
The Relative Strength Index (RSI) on the daily chart reads 65, above its neutral level of 50, and points upward, indicating that bullish momentum is gaining traction. The Moving Average Convergence (MACD) indicator on the same chart displayed a bullish crossover in early September, which remains in effect, indicating sustained bullish momentum and an upward trend ahead.
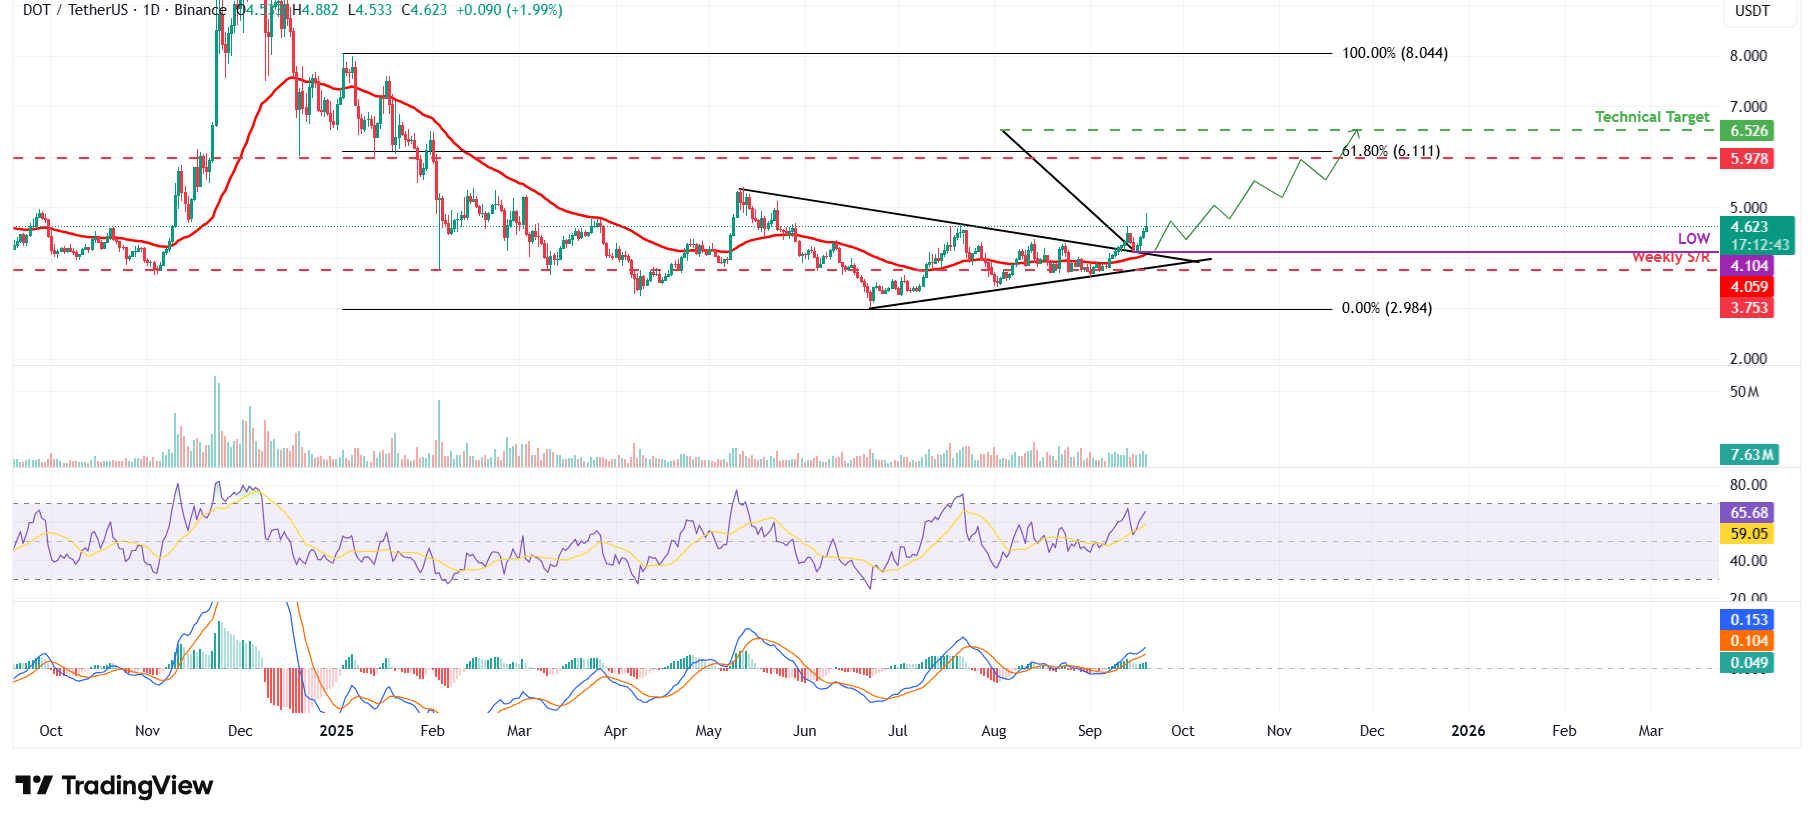
DOT/USDT daily chart
However, if DOT faces a pullback, it could extend the decline toward its Monday’s low at $4.10.
Author

Manish Chhetri
FXStreet
Manish Chhetri is a crypto specialist with over four years of experience in the cryptocurrency industry.


