- Polkadot is in a pennant and ready for the breakout.
- With five good technical reasons, bulls look to take the upper hand in DOT price action.
- A clear run higher will spell 35% returns for the bulls.
Polkadot (DOT) price has formed a pennant, with both the highs and the lows squeezed toward each other. With momentum and volume building on both sides of the spectrum, a breakout in DOT price looks to favor the bulls as they hold the most supporting elements.
Bulls hold all the aces to flush the bears out of DOT price action
Polkadot price has been stuck in a pennant for the most significant part of September, with prices squeezed in from both sides. A closer look spells fortune for the bulls with five technical elements in favor of a long. The first element is the monthly pivot at $26.67, holding price action in check since Sunday. The level launched price action back to the upside after bears had the upper hand short term. In that pivot holding, buyers reclaimed ground above both the 55-day and 200-day Simple Moving Average (SMA). Two supporting elements are helping out the bulls. With the 55-day crossing the 200-day SMA to the upside, the signal of a Golden Cross forming is flashing for technical traders to choose sides with the bulls.
DOT price action in the Relative Strength Index (RSI) is back below 50, making it slightly oversold. There is yet another reason for buyers to add some DOT coins to their portfolio. With global sentiment in favor of risk-on and stocks back in the buy-the-dip playbook, this makes Polkadot price very attractive with this discount.
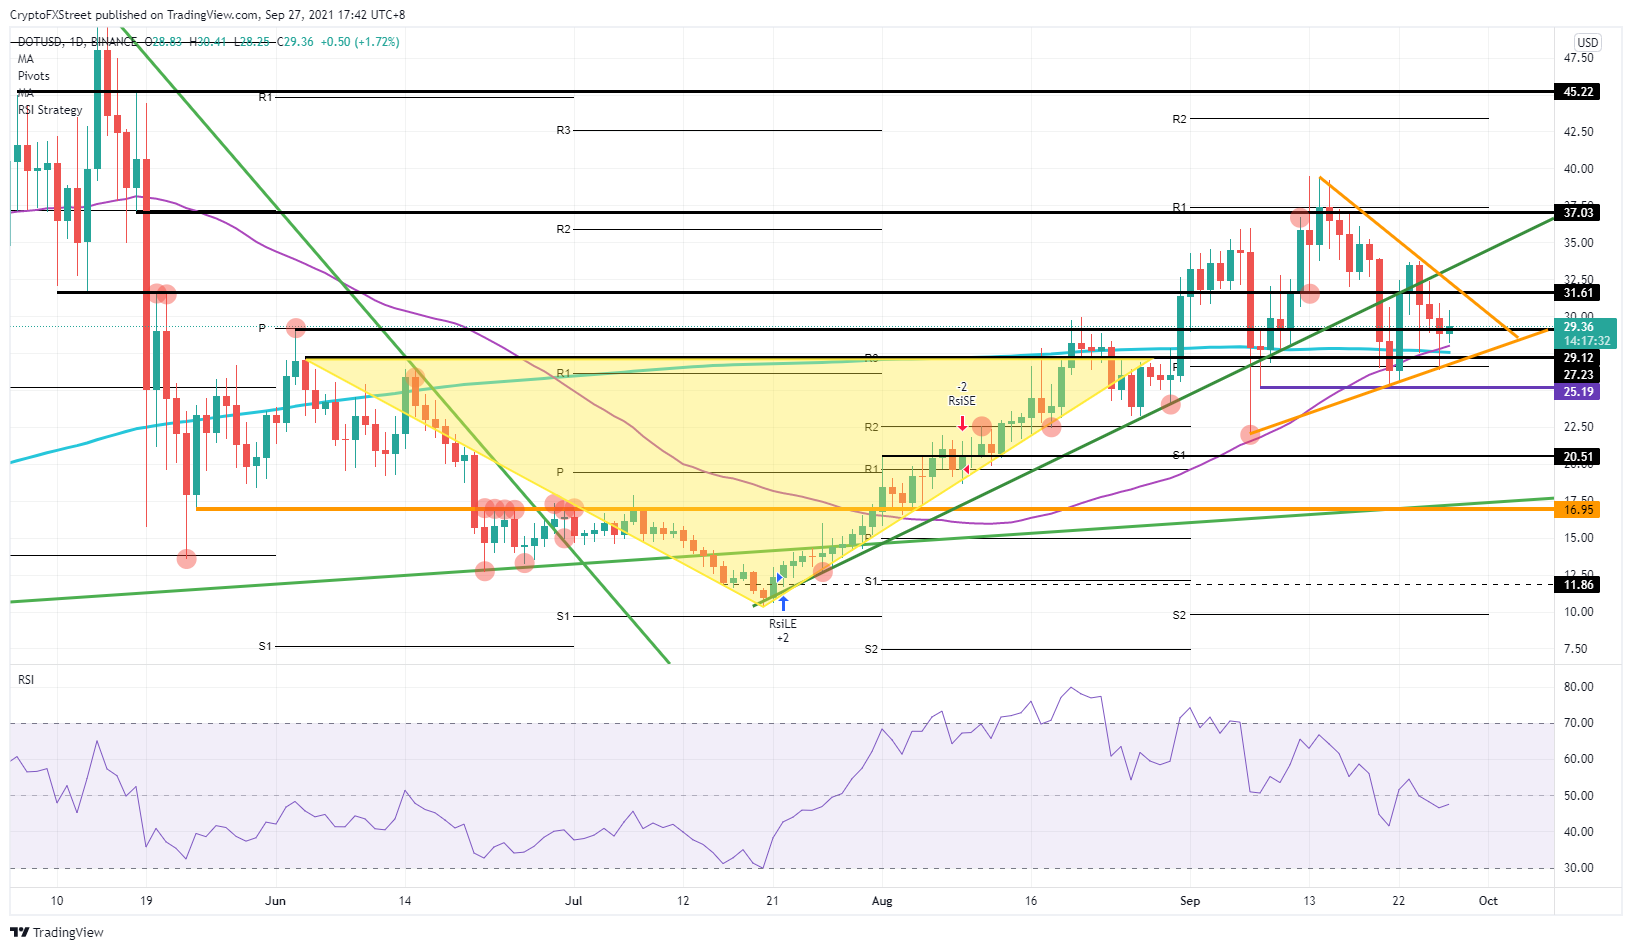
DOT/USD daily chart
Expect bulls to charge DOT price above $31.61. That level will act as a breather for a retest before bulls charge again to push for $37. Once that level is reached, expect bulls to book profit.
Sellers in Polkadot price will want to start shorting DOT at $37, with that black historical line as entry and the monthly R1 resistance level at $37.38 as an area to place their stops behind as a double belt of resistance. Once the bulls are overhauled, expect a retest of the lower band of the current pennant on the ascending orange trend line or a retest of the $29.12 level.
Like this article? Help us with some feedback by answering this survey:
Information on these pages contains forward-looking statements that involve risks and uncertainties. Markets and instruments profiled on this page are for informational purposes only and should not in any way come across as a recommendation to buy or sell in these assets. You should do your own thorough research before making any investment decisions. FXStreet does not in any way guarantee that this information is free from mistakes, errors, or material misstatements. It also does not guarantee that this information is of a timely nature. Investing in Open Markets involves a great deal of risk, including the loss of all or a portion of your investment, as well as emotional distress. All risks, losses and costs associated with investing, including total loss of principal, are your responsibility. The views and opinions expressed in this article are those of the authors and do not necessarily reflect the official policy or position of FXStreet nor its advertisers. The author will not be held responsible for information that is found at the end of links posted on this page.
If not otherwise explicitly mentioned in the body of the article, at the time of writing, the author has no position in any stock mentioned in this article and no business relationship with any company mentioned. The author has not received compensation for writing this article, other than from FXStreet.
FXStreet and the author do not provide personalized recommendations. The author makes no representations as to the accuracy, completeness, or suitability of this information. FXStreet and the author will not be liable for any errors, omissions or any losses, injuries or damages arising from this information and its display or use. Errors and omissions excepted.
The author and FXStreet are not registered investment advisors and nothing in this article is intended to be investment advice.
Recommended Content
Editors’ Picks
Ripple's move above this key level could trigger nearly 50% rally for XRP
Ripple has overcome a critical resistance level and flipped into a support floor on the weekly time frame. This development happened while XRP tightly consolidated for roughly 250 days. Investors can expect XRP to kickstart a massive rally.
Optimism price outlook with nearly $90 million worth of OP tokens flooding markets on Friday
Optimism volatility has shrunk in the ours leading to the network’s cliff unlock. It joins the likes of dYdX and Sui, which have similar events on their calendars. As token unlocks are often considered bearish catalysts, investors should brace for a reaction after the event.
Top 3 Price Prediction Bitcoin, Ethereum, Ripple: Retail watches from the sidelines with a bias for shorts
Bitcoin could clear $73,777 peak as BTC bulls resurface. Ethereum might fall 10% before next leg up as ETH RSI teases with sell signal. XRP could lose $0.6000 threshold as Ripple bulls fail to show up.
Jito price could hit $6 as JTO coils up inside this bullish pattern
Jito price action shows a potential cup and handle formation. Based on theoretical measurement rules, a successful breakout could yield a 56% rally to $6.0. A breakdown of the $3.86 support level would create a lower low for JTO and invalidate the bullish thesis.
Bitcoin: BTC may have recovered, but is it out of the woods?
Bitcoin’s (BTC) upward momentum has shown a significant decline for the past two weeks or so. This development led to a bearish signal on the weekly and an uncertain outlook on the monthly.