Polkadot bullish bias unchanged despite drop, DOT to hit $50
- Polkadot price suffered the same drop and selling pressure experienced by the broader crypto market.
- DOT is relatively unchanged despite the fall and has maintained a stable support zone.
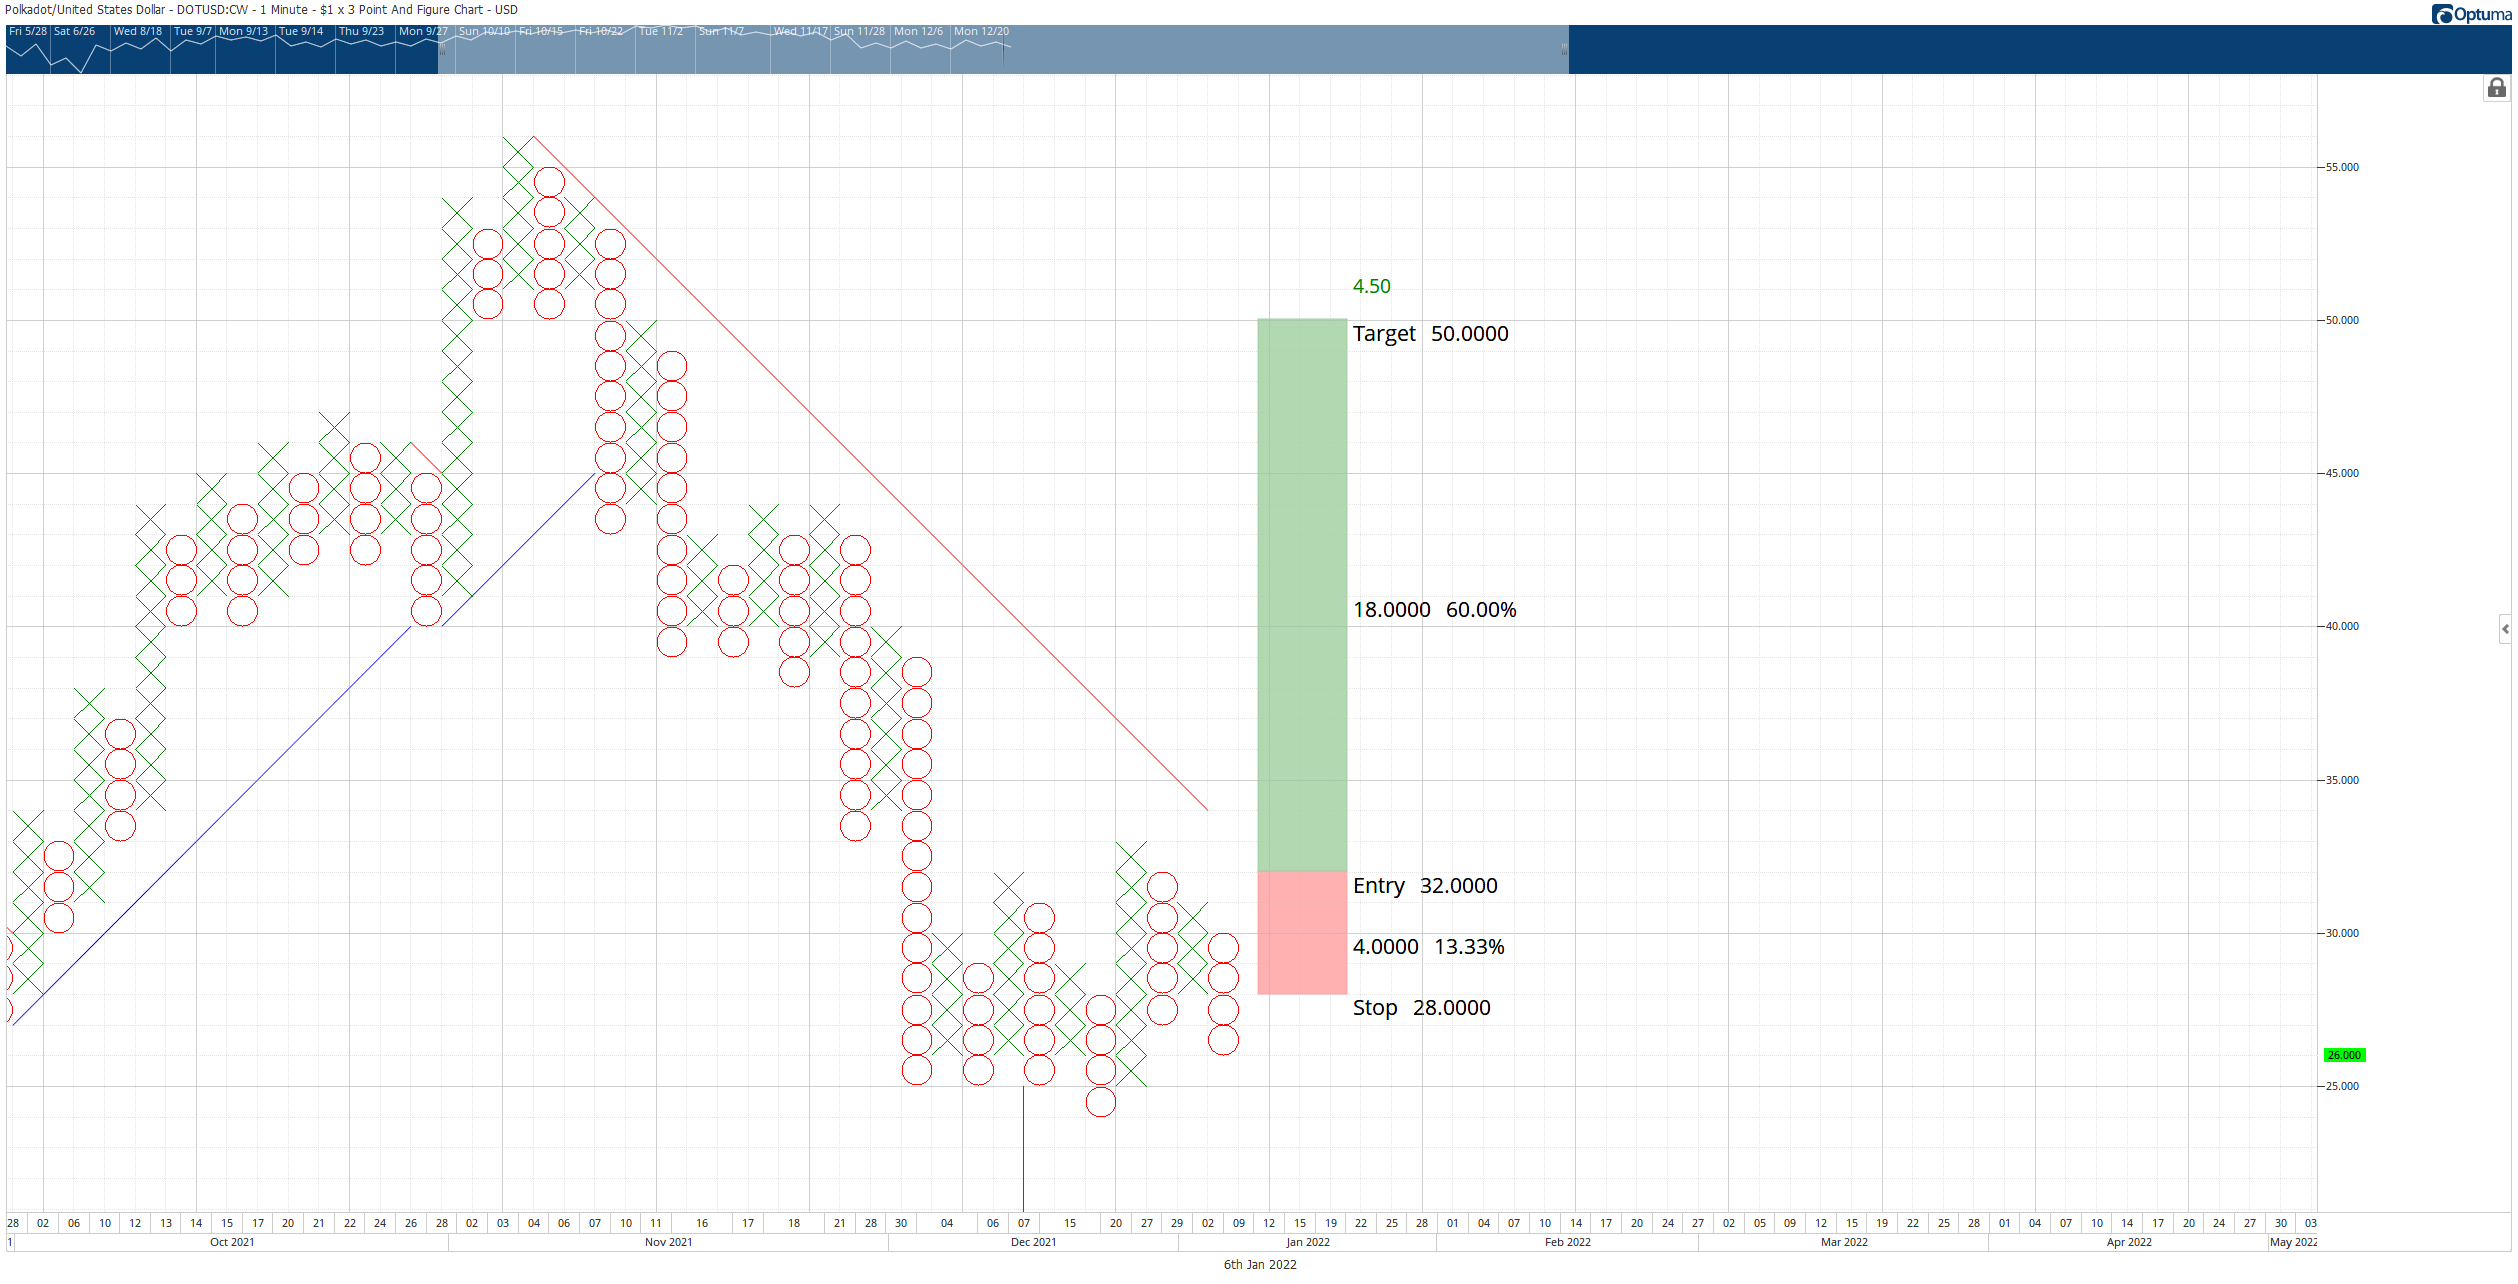
- Bear trap set up on the Point and Figure chart indicates near-term bullish momentum.

Polkadot price continues to trade in a range between the 38.2% Fibonacci retracement at $31 and the 50% Fibonacci retracement at $26. However, the Point and Figure chart shows a possible Bear Trap Point and Figure pattern may play out.
Polkadot price could trigger a bullish reversal and spike higher to the $50 value area
Polkadot price is ready to surprise the market and return to a bull market. There is a highly positive bullish confluence of activity for DOT at the entry level of the Bear Trap pattern currently developing on the $1.00/3-box reversal Point and Figure chart. If the entry identified below triggers, Polkadot will simultaneously confirm the Bear Trap pattern and breakout above the bear market trendline to convert DOT into a bull market.
The hypothetical long setup off the Bear Trap setup is a buy stop order at $32, a stop loss at $28, and a profit target at $50. This trade setup represents a 4.5:1 reward/risk and has an implied profit of 60% from the entry. A two to three-box trailing stop would help protect any profit made post entry.
DOT/USDT $1.00/3-box Reversal Point and Figure Chart
Polkadot price can move one box lower to $25 before the entry is triggered. If that occurs, the Bear Trap pattern turns into a Bearish Fakeout setup, an even stronger bullish reversal pattern. However, a drop to $24 before the entry is triggered would invalidate the hypothetical long setup.
Author

Jonathan Morgan
Independent Analyst
Jonathan has been working as an Independent future, forex, and cryptocurrency trader and analyst for 8 years. He also has been writing for the past 5 years.


