Polkadot Elliott Wave technical analysis [Video]
![Polkadot Elliott Wave technical analysis [Video]](https://editorial.fxsstatic.com/images/i/DOT-neutral-line_XtraLarge.png)
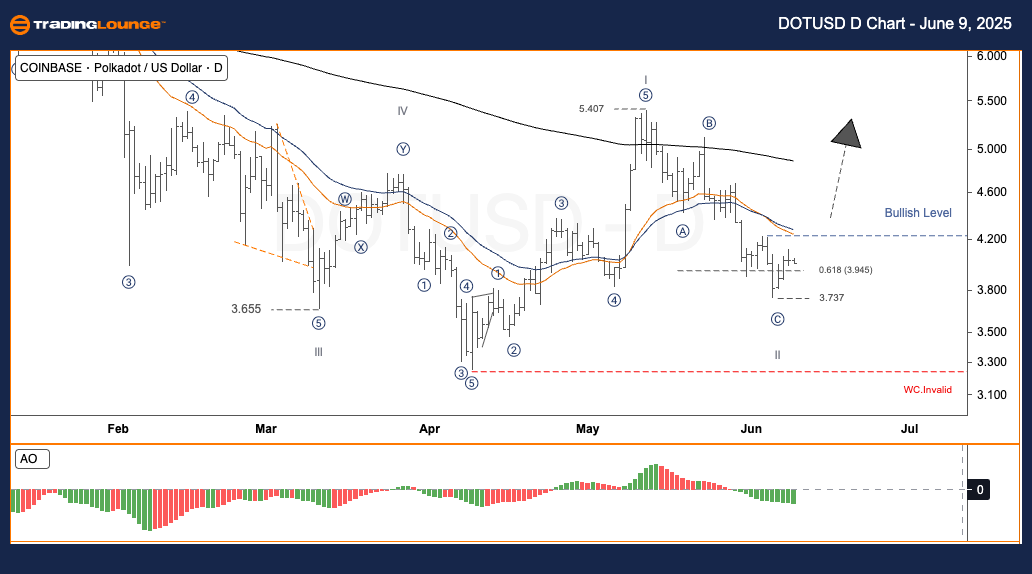
DOT/USD Elliott Wave technical analysis
Function: Follow Trend.
Mode: Motive.
Structure: Impulse.
Position: Wave 2.
Direction next higher degrees:
Wave cancel invalid level:
DOT/USD trading strategy
DOTUSD completed wave I at a peak of 5.407, after which it entered a corrective phase under the ABC format in wave II. The most recent wave C appears to have concluded at 3.737, aligning closely with the 0.618 Fibonacci retracement level from wave I, set at 3.945. This indicates a potential shift into wave III, typically associated with upward momentum. If the price surpasses the critical 4.40 resistance level—defined as the Bullish Level—it would confirm the conclusion of wave II.
Trading strategies
-
Strategy
- Swing Traders (Short-Term)
- Long Position: Enter after a confirmed breakout above 4.40, signifying wave III has started.
-
Risk management:
-
Place a Stop Loss just under 3.30
-
Daily chart
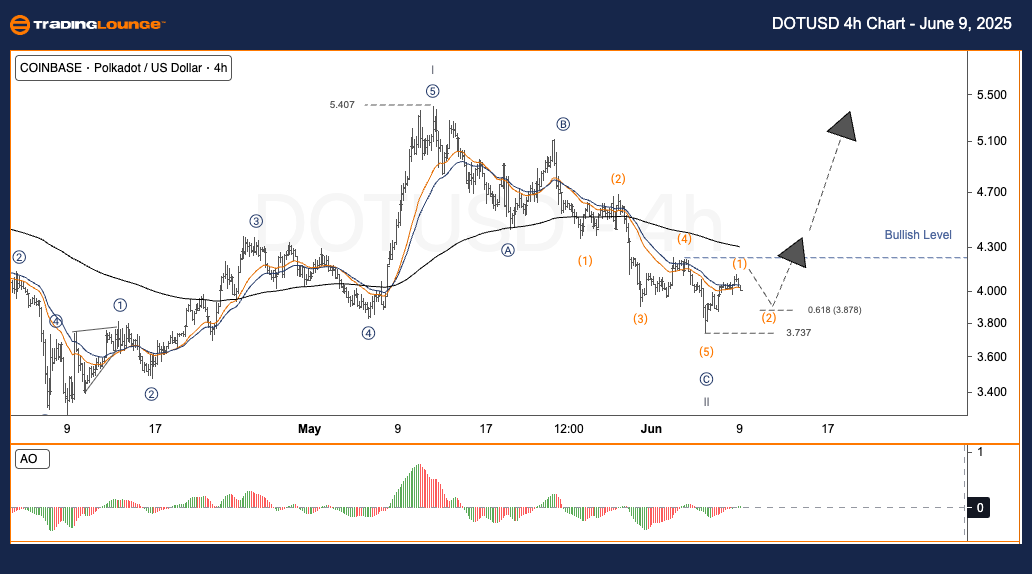
DOT/USD Elliott Wave technical analysis
Function: Follow Trend.
Mode: Motive.
Structure: Impulse.
Position: Wave 2.
Direction next higher degrees:
Wave cancel invalid level:
DOT/USD trading strategy
DOTUSD wrapped up wave I at 5.407, after which it retraced in wave II via an ABC structure. The recent wave C seems to have ended at 3.737, effectively testing the 0.618 Fibonacci level of wave I at 3.945. This behavior hints that wave III may now be unfolding—typically a stronger, upward-trending leg. A breakout above 4.40 would validate that wave II has concluded.
Trading strategies
-
Strategy
-
Swing traders (short-term)
-
Long Position: Wait until the price breaks above 4.40 before entering.
-
-
-
Risk management:
-
Stop Loss should be placed below 3.30.
-
Polkadot Elliott Wave technical analysis [Video]
Author

Peter Mathers
TradingLounge
Peter Mathers started actively trading in 1982. He began his career at Hoei and Shoin, a Japanese futures trading company.


