Polkadot Price Prediction: DOT breakdown looms amid intensifying selling pressure
- Polkadot is staring into the abyss, especially if the ascending triangle support is broken.
- The Relative Strength Index adds credibility to the breakdown after printing a bearish divergence.

Polkadot has pushed for recovery after last week’s rejection at $5.5. Support was embraced above the 200 Simple Moving Average on the 4-hour chart. However, the rally hit a wall at $5.25, calling for an increase in sell orders. A massive breakdown could come into the picture if DOT stretches under the 200 SMA.
Polkadot is on the verge of a significant breakdown
At the time of writing, DOT/USD is dancing at $5. The 50 SMA limits the immediate upside, hence the ongoing retreat. To avert the potential losses, Polkadot must hold above the hypotenuse of the ascending triangle.
Trading below the ascending trendline might trigger an upsurge in sell orders. If the selling volume increases, Polkadot will be forced to seek refuge at the 200 SMA as mentioned. However, massive losses are likely to come into the picture, eyeing the next probable support between $4.3 and $4.5.
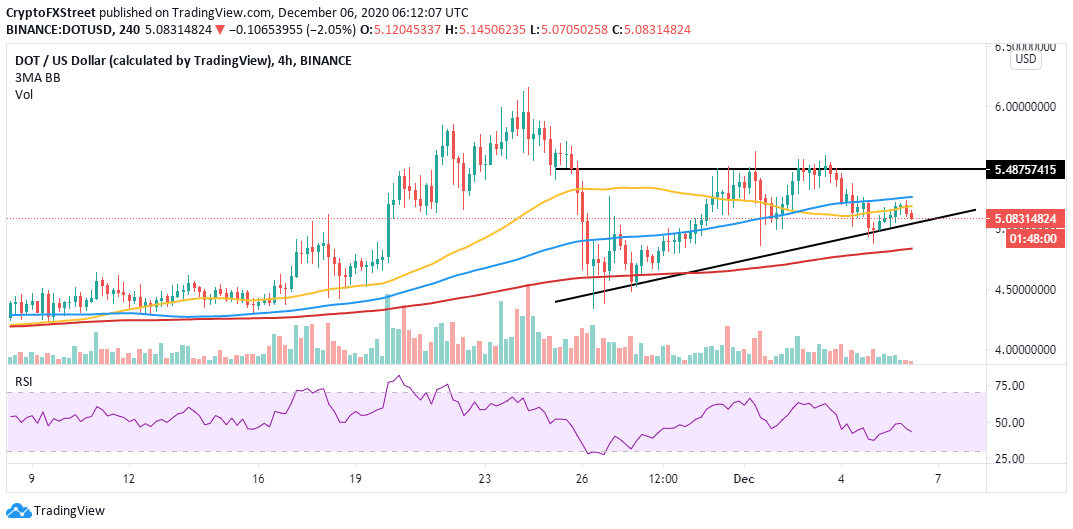
DOT/USD 4-hour chart
The Relative Strength Index adds credibility to the expected breakdown after printing a bearish divergence. This divergence forms when the RSI forms a series of lower highs while the price is creating a series of higher lows. It indicates a reduction in buying volume and, therefore, the likelihood of a correction coming into the picture.
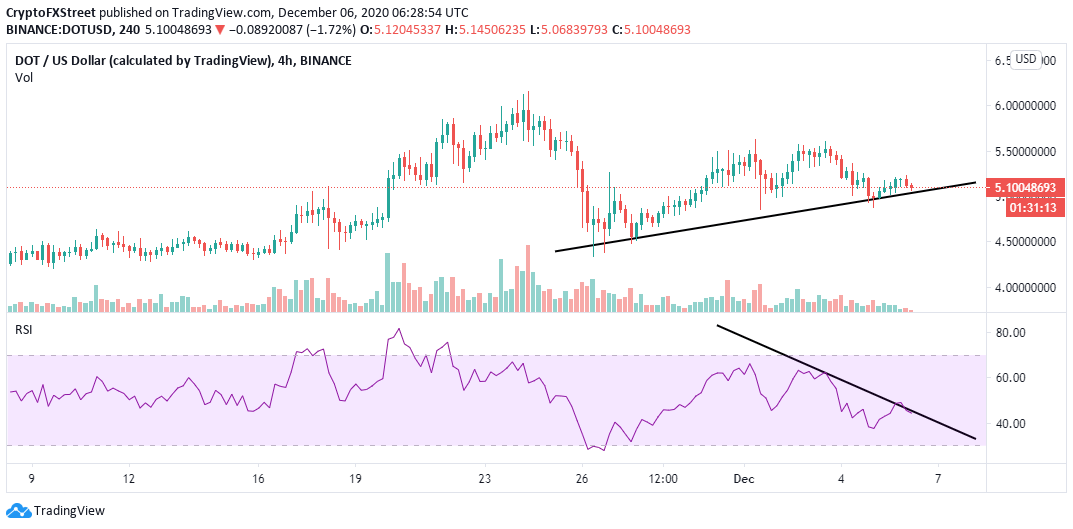
DOT/USD 4-hour chart
It is worth noting that the bearish outlook will be abandoned if DOT/USD holds firmly to the hypotenuse. A reversal might come into play, mostly if the price closed the day above the 100 SMA. Trading above the x-axis would place Polkadot on the pathway to highs around $6.5.
Author

John Isige
FXStreet
John Isige is a seasoned cryptocurrency journalist and markets analyst committed to delivering high-quality, actionable insights tailored to traders, investors, and crypto enthusiasts. He enjoys deep dives into emerging Web3 tren




