Polkadot Elliott Wave technical analysis [Video]
![Polkadot Elliott Wave technical analysis [Video]](https://editorial.fxstreet.com/images/Markets/Currencies/Cryptocurrencies/Polkadot/polkadot-150x150logo-637399979978734311_XtraLarge.png)
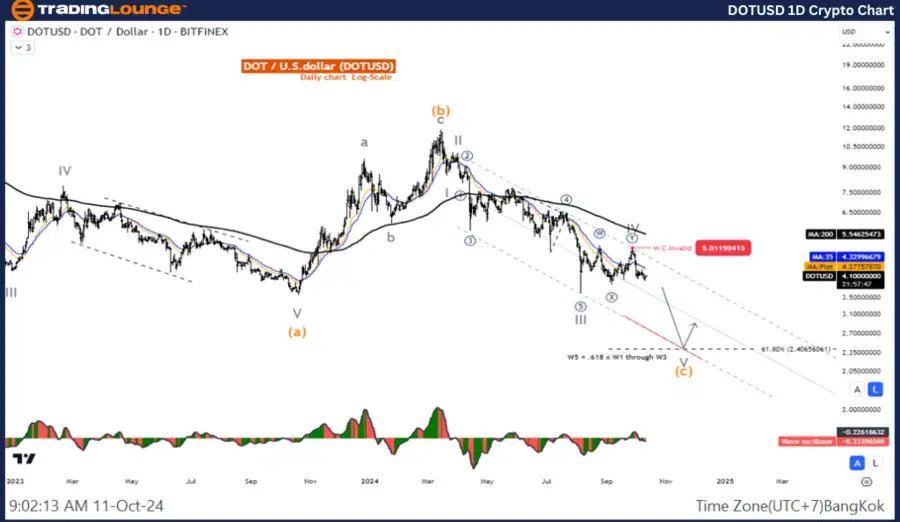
Elliott Wave Analysis TradingLounge Daily Chart,
DOT/ U.S. dollar(DOTUSD).
DOTUSD Elliott Wave technical analysis
Function: Counter Trend.
Mode: Corrective.
Structure: Double Corrective.
Position: Wave ((Y)).
Direction Next higher Degrees: Wave IV.
Wave cancel invalid level:
Details: Wave IV is likely to be completed and price is likely to drop at 2.406.
DOT/ U.S. dollar(DOTUSD)Trading Strategy:
This is a V wave retracement of wave (C), where we are in the final stages of wave C, which is likely to test the 2.406 level, so the overall picture is a short-term retracement before another rally.
DOT/ U.S. dollar(DOTUSD)Technical Indicators: The price is below the MA200 indicating a Downtrend, The Wave Oscillator is a Bearish Momentum.
DOT/ U.S. dollar(DOTUSD)
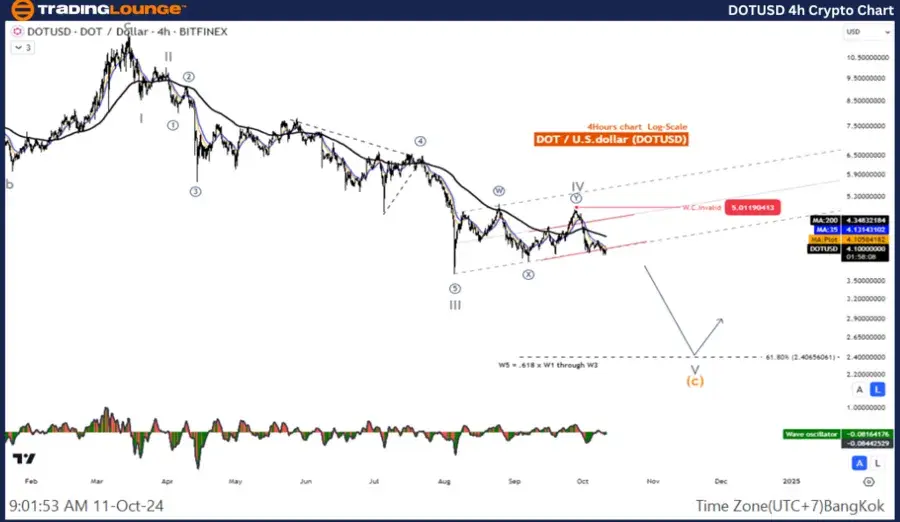
DOTUSD Elliott Wave technical analysis
Function: Counter Trend.
Mode: Corrective.
Structure: Double Corrective.
Position: Wave ((Y)).
Direction next higher degrees: Wave IV.
Wave cancel invalid level:
Details: Wave IV is likely to be completed and price is likely to drop at 2.406.
DOT/ U.S. dollar(DOTUSD)Trading Strategy:
This is a V wave retracement of wave (C), where we are in the final stages of wave C, which is likely to test the 2.406 level, so the overall picture is a short-term retracement before another rally.
DOT/ U.S. dollar(DOTUSD)Technical Indicators: The price is below the MA200 indicating a Downtrend, The Wave Oscillator is a Bearish Momentum.
Technical analyst: Kittiampon Somboonsod.
DOTUSD Elliott Wave technical analysis [Video]
Author

Peter Mathers
TradingLounge
Peter Mathers started actively trading in 1982. He began his career at Hoei and Shoin, a Japanese futures trading company.


