Polkadot awaits bullish breakout that would see DOT rally more than 50%
- Polkadot price continues to consolidate and form a base in the $20 value area.
- Powerful reversal setup on DOT’s $2.00/3-box reversal Point and Figure chart.
- Downside risks exist but should be limited in scale and scope when compared against upside opportunities.

Polkadot price action remains bound to the $20 value area. A large Spike Pattern on the Point and Figure chart has existed for over three months without a single reversal column. The probability of a bullish rally increases.
Polkadot price develops bullish reversal pattern, signaling a significant long-term 3:1 rally
Polkadot price has one of the longest-lasting Spike Patters on its Point and Figure chart of the entire cryptocurrency market. The beginning of the current O-column was first developed on November 3, 2021. Since November 3, 2021, DOT has yet to have a reversal column of Xs develop. Although no time factor exists on a Point and Figure chart, the length of time without a reversal is notable and considerable.
A Spike Pattern is any column with fifteen or more Xs or Os. It represents extremes and overdone movements. The entry off of a Spike Pattern is the three-box reversal. Compared to other patterns in Point and Figure analysis, the Spike Pattern requires active management and is a more aggressive entry.
The theoretical long entry opportunity is a buy stop order at $26, a stop loss at $18, and a profit target at $100. The profit target is derived from the Vertical Profit Target Method in Point and Figure analysis and should not be viewed as a target likely to hit anytime in the near future. Given the resistance levels that have been discussed in prior analysis and on the existing Ichimoku charts, the $35 to $40 value area is likely to stop Polkadot’s initial rally from the entry.
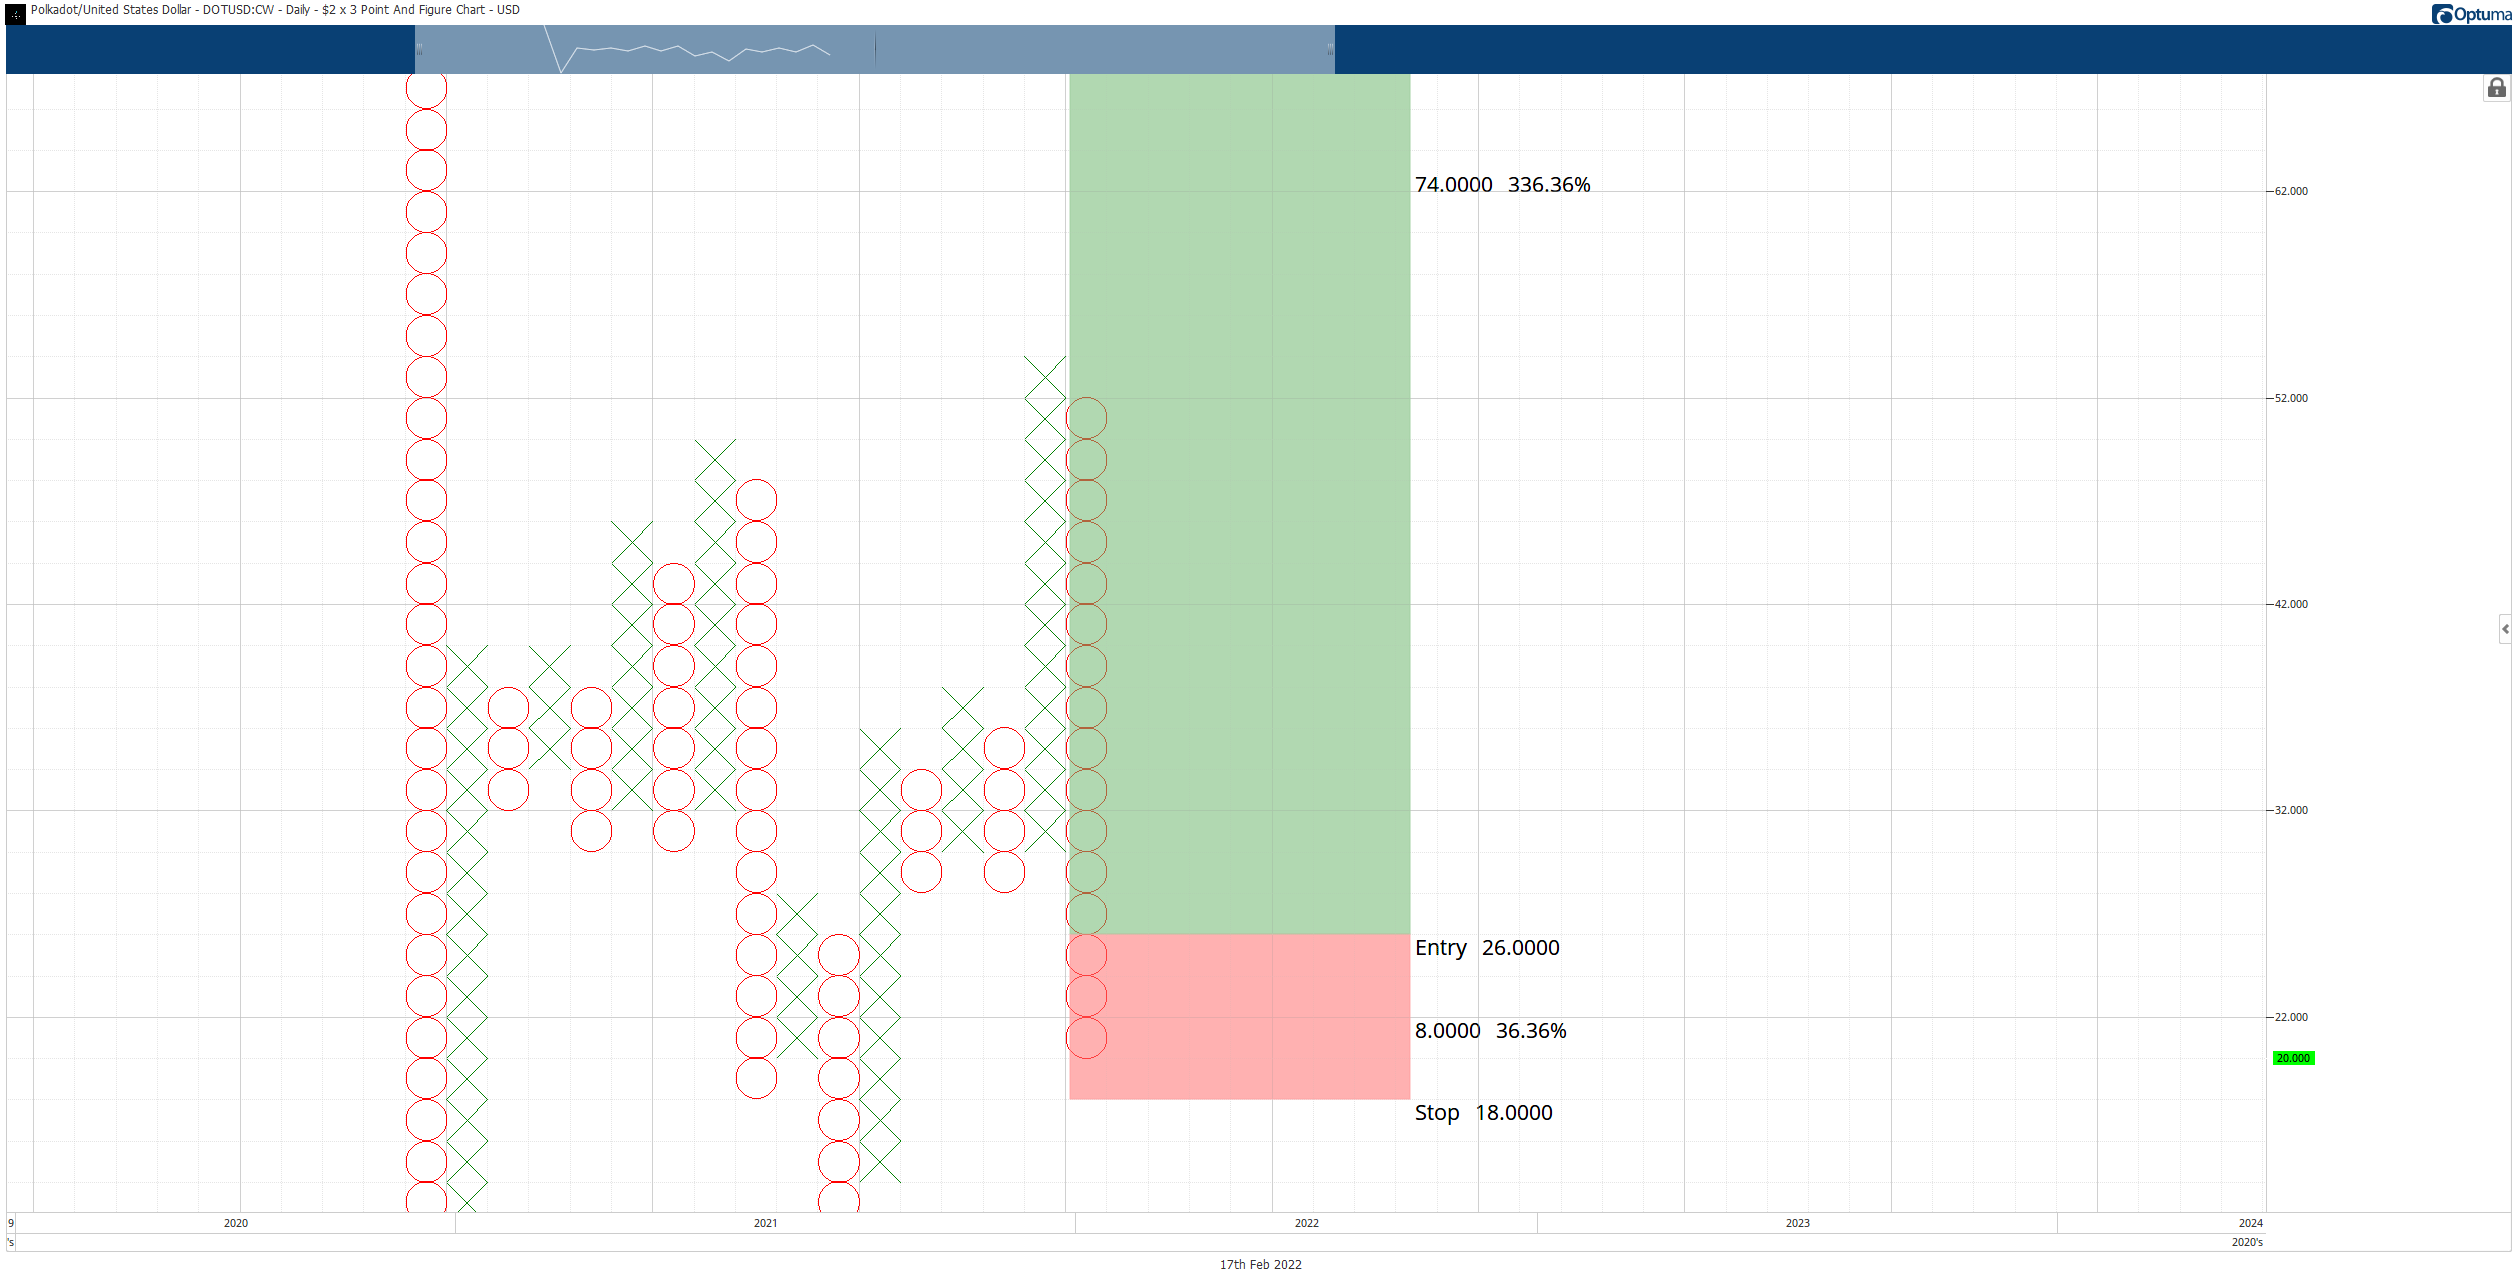
DOT/USD $2.00/3-box Reversal Point and Figure Chart
Additionally, because it is a Spike Pattern, the low of the current O-column is not known. Therefore, if Polkadot price moves lower, the entry and four-box stop loss move in tandem with price.
Downside risks are likely limited to the 2022 lows near $17.
Author

Jonathan Morgan
Independent Analyst
Jonathan has been working as an Independent future, forex, and cryptocurrency trader and analyst for 8 years. He also has been writing for the past 5 years.



