Polkadot capitulation move ahead could see DOT return to July 2021 lows near $11
- Polkadot price failed to hold support in the $20 to $21 value area.
- DOT is less than $1 away from triggering a massive sell-off signal within the Ichimoku Kinko Hyo system.
- Hidden bullish divergence is the only condition that could prevent a massive sell-off.

Polkadot price has been hammered south since last Thursday. DOT has lost up to 21% in just five days, returning it precipitously close to three-month and 2022 lows.
Polkadot price is at a make-or-break moment, 40% drop incoming unless bullish momentum returns
Polkadot price is very close to experiencing conditions that could trigger a flash-crash. DOT is below all Ichimoku levels on the daily and weekly charts, warning of easy, swift, and violent moves south.
One condition remains on the daily Ichimoku chart before Polkadot price could see a flash-crash, and that is the Chikou Span in open space. In the Ichimoku system, the Chikou Span in open space is similar to a ‘price discovery mode’ condition. It is a condition where little to no support or resistance exists to stop price action from moving in a single direction.
Open space required the Chikou Span to be at a price level where it won’t intercept the bodies of any candlesticks, horizontally, over the next five to ten periods. Therefore, if Polkadot price has a daily close at or below $18, then that will place the Chikou Span in open space and put Polkadot at its weakest technical level since December 3, 2021.
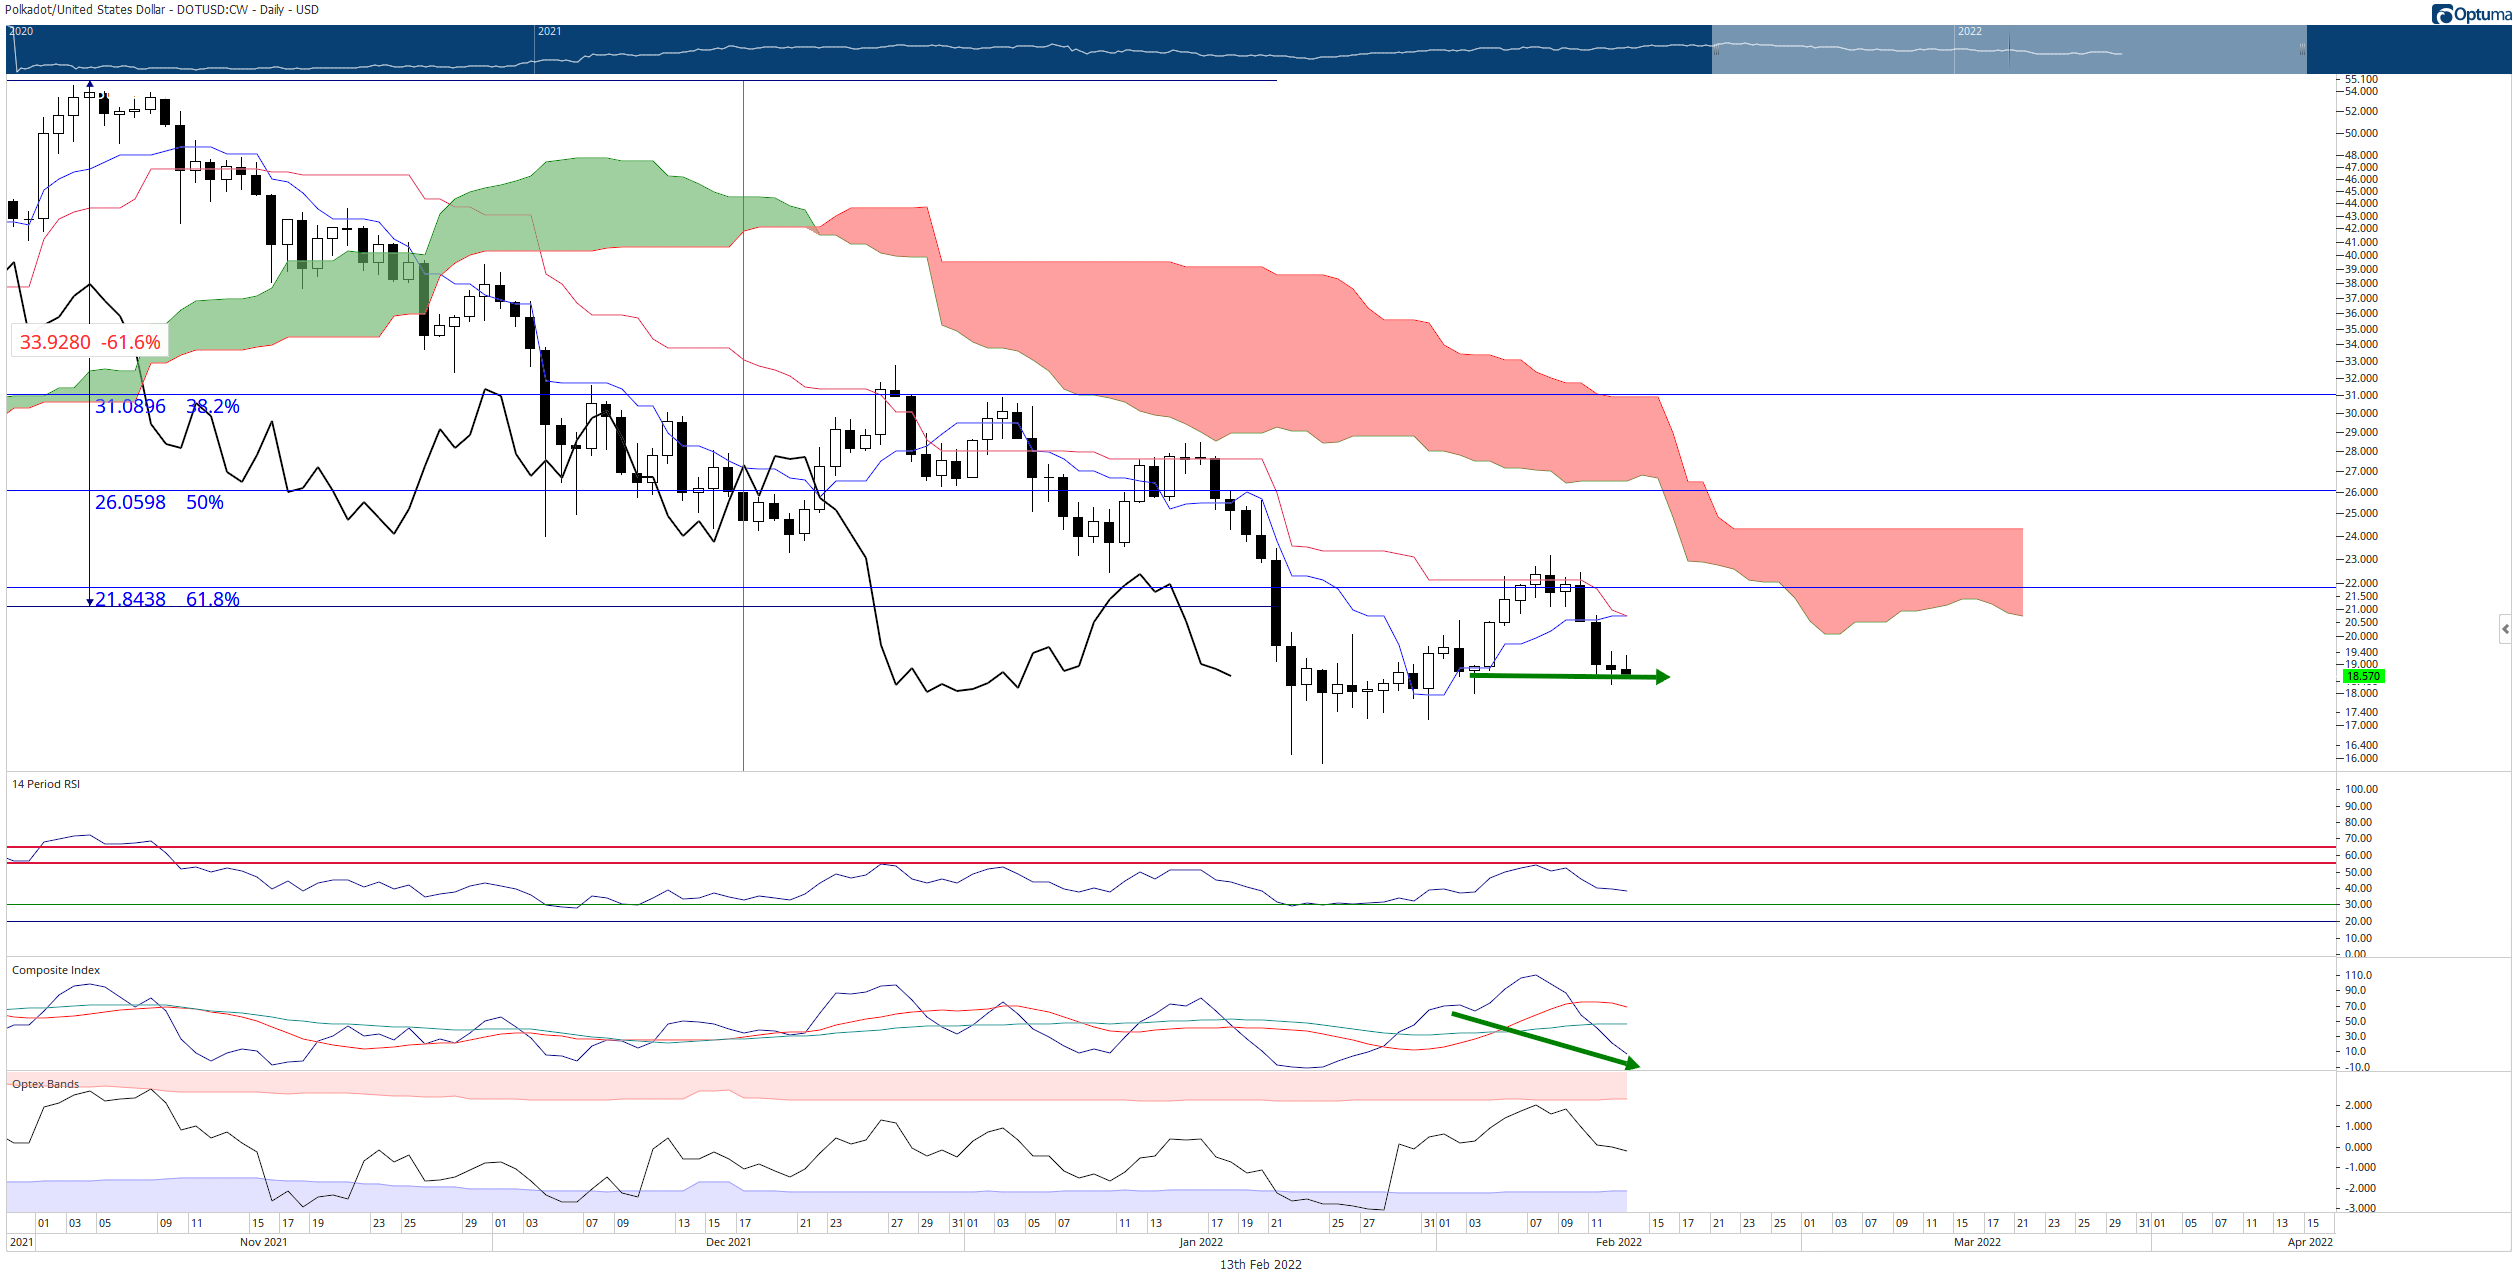
DOT/USD Daily Ichimoku Kinko Hyo Chart
The only saving grace for Polkdaot price is the possibility of hidden bullish divergence playing out in the bull’s favor. However, with no structural Ichimoku support on the daily or weekly charts, it is unlikely that price would respond in a bullish manner.
If bulls want to stave off a sell-off of Polkadot price, they will ultimately need to close Polkadot price above the Tenkan-Sen, Kijun-Sen, and 38.2% Fibonacci retracement at $22 or above. In that scenario, any further near-term bearish outlook would probably be invalidated.
Author

Jonathan Morgan
Independent Analyst
Jonathan has been working as an Independent future, forex, and cryptocurrency trader and analyst for 8 years. He also has been writing for the past 5 years.


