Pi Network Price Forecast: Decline continues as $0.43 support faces pressure
- Pi Network edges lower to the $0.43 support level as the lower high streak continues on the 4-hour chart.
- An unknown wallet acquires 1.40 million PI tokens, signaling confidence in the network.
- The technical outlook indicates an increased downside risk as buying pressure declines.

Pi Network (PI) edges lower by 0.61% at press time on Tuesday following the bullish failure to hold at higher levels on Monday. Amid the pullback to its weekly support of $0.43, an unknown wallet address has acquired 1.40 million PI tokens, advancing its week-long buying spree. Still, the technical outlook remains bearish as the bullish momentum wanes.
Large investor extends the PI tokens buying spree for a week
PiScan data indicates that the “GASWBD...J2AODM” wallet, potentially associated with a large investor, has added over 1.4 million PI tokens from the OKX exchange. The purchase marks the biggest transaction on the network in the last 24 hours.
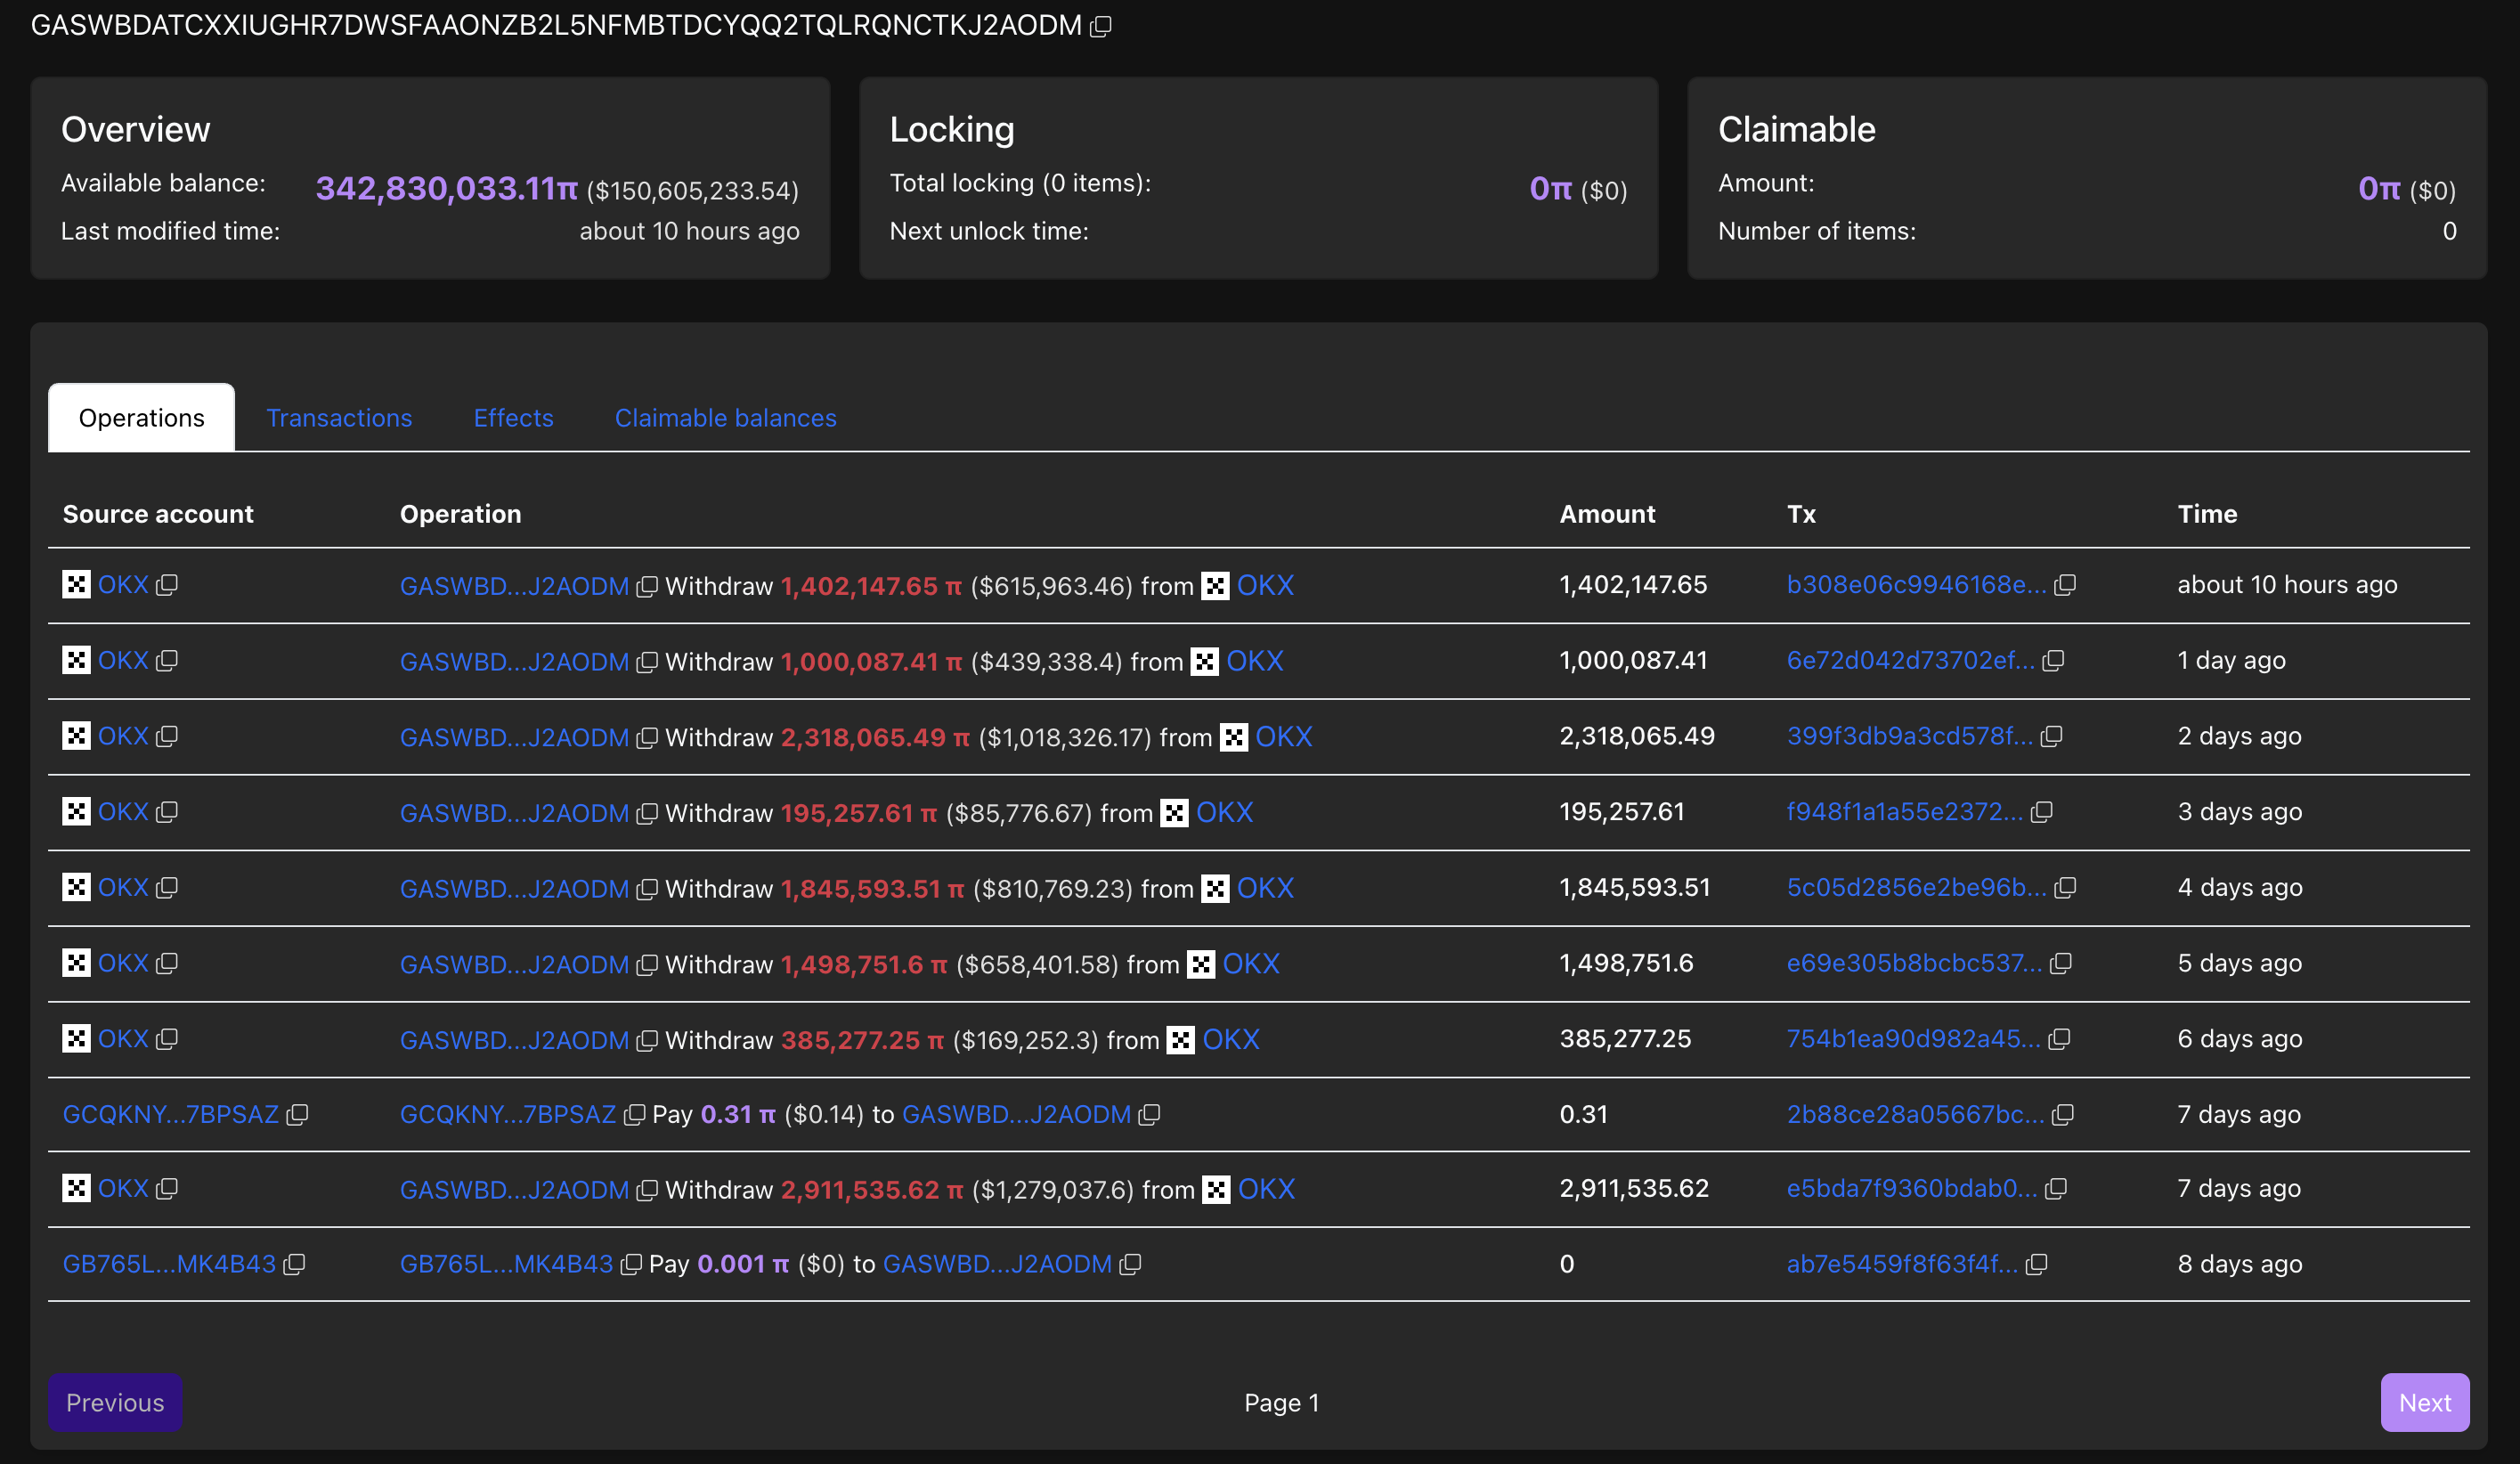
Wallet transactions. Source: PiScan
It is worth noting that the large investor has acquired over 11 million PI tokens in the last seven days.
PI risks losing the $0.43 support level as buying pressure declines
PI fails to uphold the bullish momentum spark on Monday as overhead selling pressure at the 100-day Exponential Moving Average (EMA) results in the $0.43 support level retest. The support level has remained intact since July 15, avoiding a candlestick close below this level on the 4-hour chart.
If PI falls below this level, it could test the $0.42 level, marked by the low of July 15, followed by the $0.40 psychological level.
The Relative Strength Index (RSI) faces downside as it falls to 42 below the midpoint line, suggesting a decrease in buying pressure.
The Moving Average Convergence Divergence (MACD) is on the verge of closing below the signal line, which would flash a trend reversal and a sell signal.
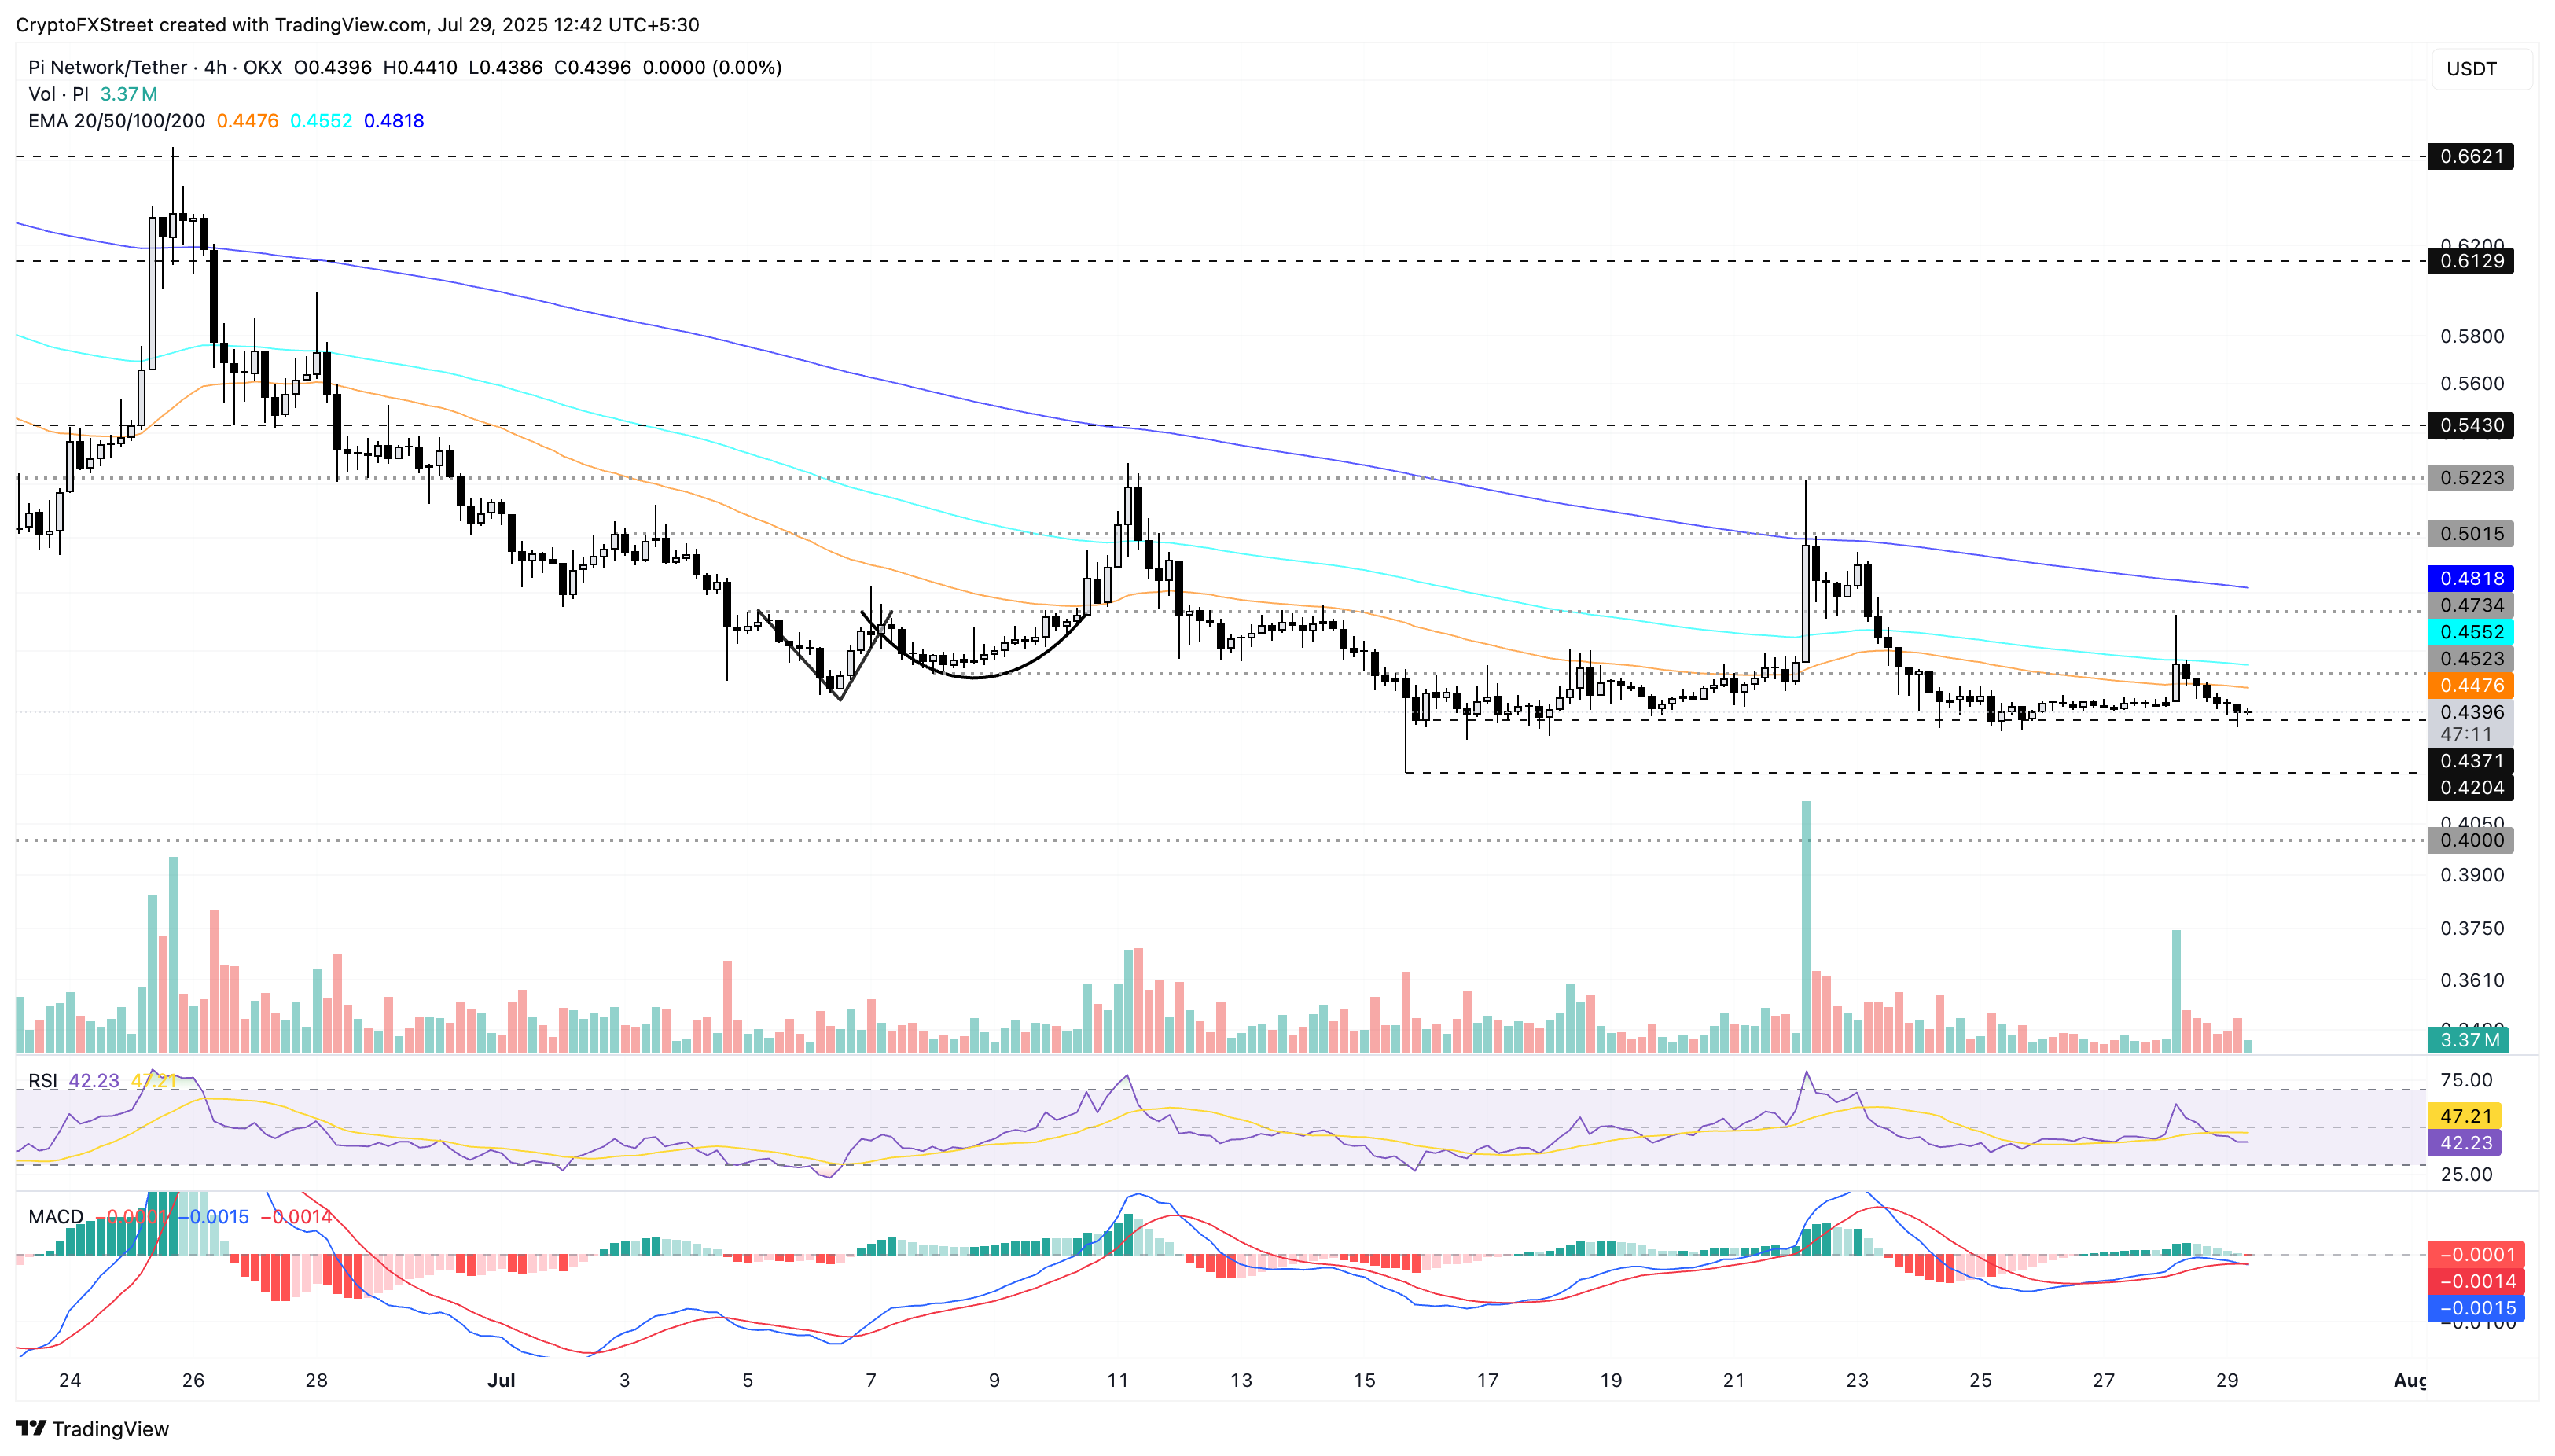
PI/USDT daily price chart.
On the other hand, a reversal above the 200-day EMA could reestablish a bullish trend, targeting the $0.50 psychological level.
Open Interest, funding rate FAQs
Higher Open Interest is associated with higher liquidity and new capital inflow to the market. This is considered the equivalent of increase in efficiency and the ongoing trend continues. When Open Interest decreases, it is considered a sign of liquidation in the market, investors are leaving and the overall demand for an asset is on a decline, fueling a bearish sentiment among investors.
Funding fees bridge the difference between spot prices and prices of futures contracts of an asset by increasing liquidation risks faced by traders. A consistently high and positive funding rate implies there is a bullish sentiment among market participants and there is an expectation of a price hike. A consistently negative funding rate for an asset implies a bearish sentiment, indicating that traders expect the cryptocurrency’s price to fall and a bearish trend reversal is likely to occur.
Author

Vishal Dixit
FXStreet
Vishal Dixit holds a B.Sc. in Chemistry from Wilson College but found his true calling in the world of crypto.



