Pi Network Price Forecast: PI hit a crucial crossroads as bullish momentum fades
- Pi Network edges lower to retest crucial support floor, erasing Tuesday's gains.
- CEXs’ token balances surge, signaling increased selling ahead of the 10.8 million PI token unlock on Monday.
- The technical outlook suggests a surge in bearish momentum, indicating further losses.

Pi Network (PI) edges lower by 2% at press time on Thursday, extending the declining trend to a crucial support floor. An inflow surge of the Centralized Exchanges (CEXs) wallet balances ahead of the 10.8 million PI token unlock signals a rise in selling pressure as traders book profit ahead of the incoming supply spike.
The technical outlook warns of further losses that could test the historical low of $0.40.
CEXs' wallet balances surge ahead of 10.8 million PI token unlock
PiScan data shows a net inflow of 704,237 PI tokens on CEXs' wallet balances so far on Thursday, with Gate.io holding over 194 million PI tokens out of the total 401 million CEXs' wallet balances. Typically, a surge in selling pressure boosts CEXs' balances as traders or the team book profits.
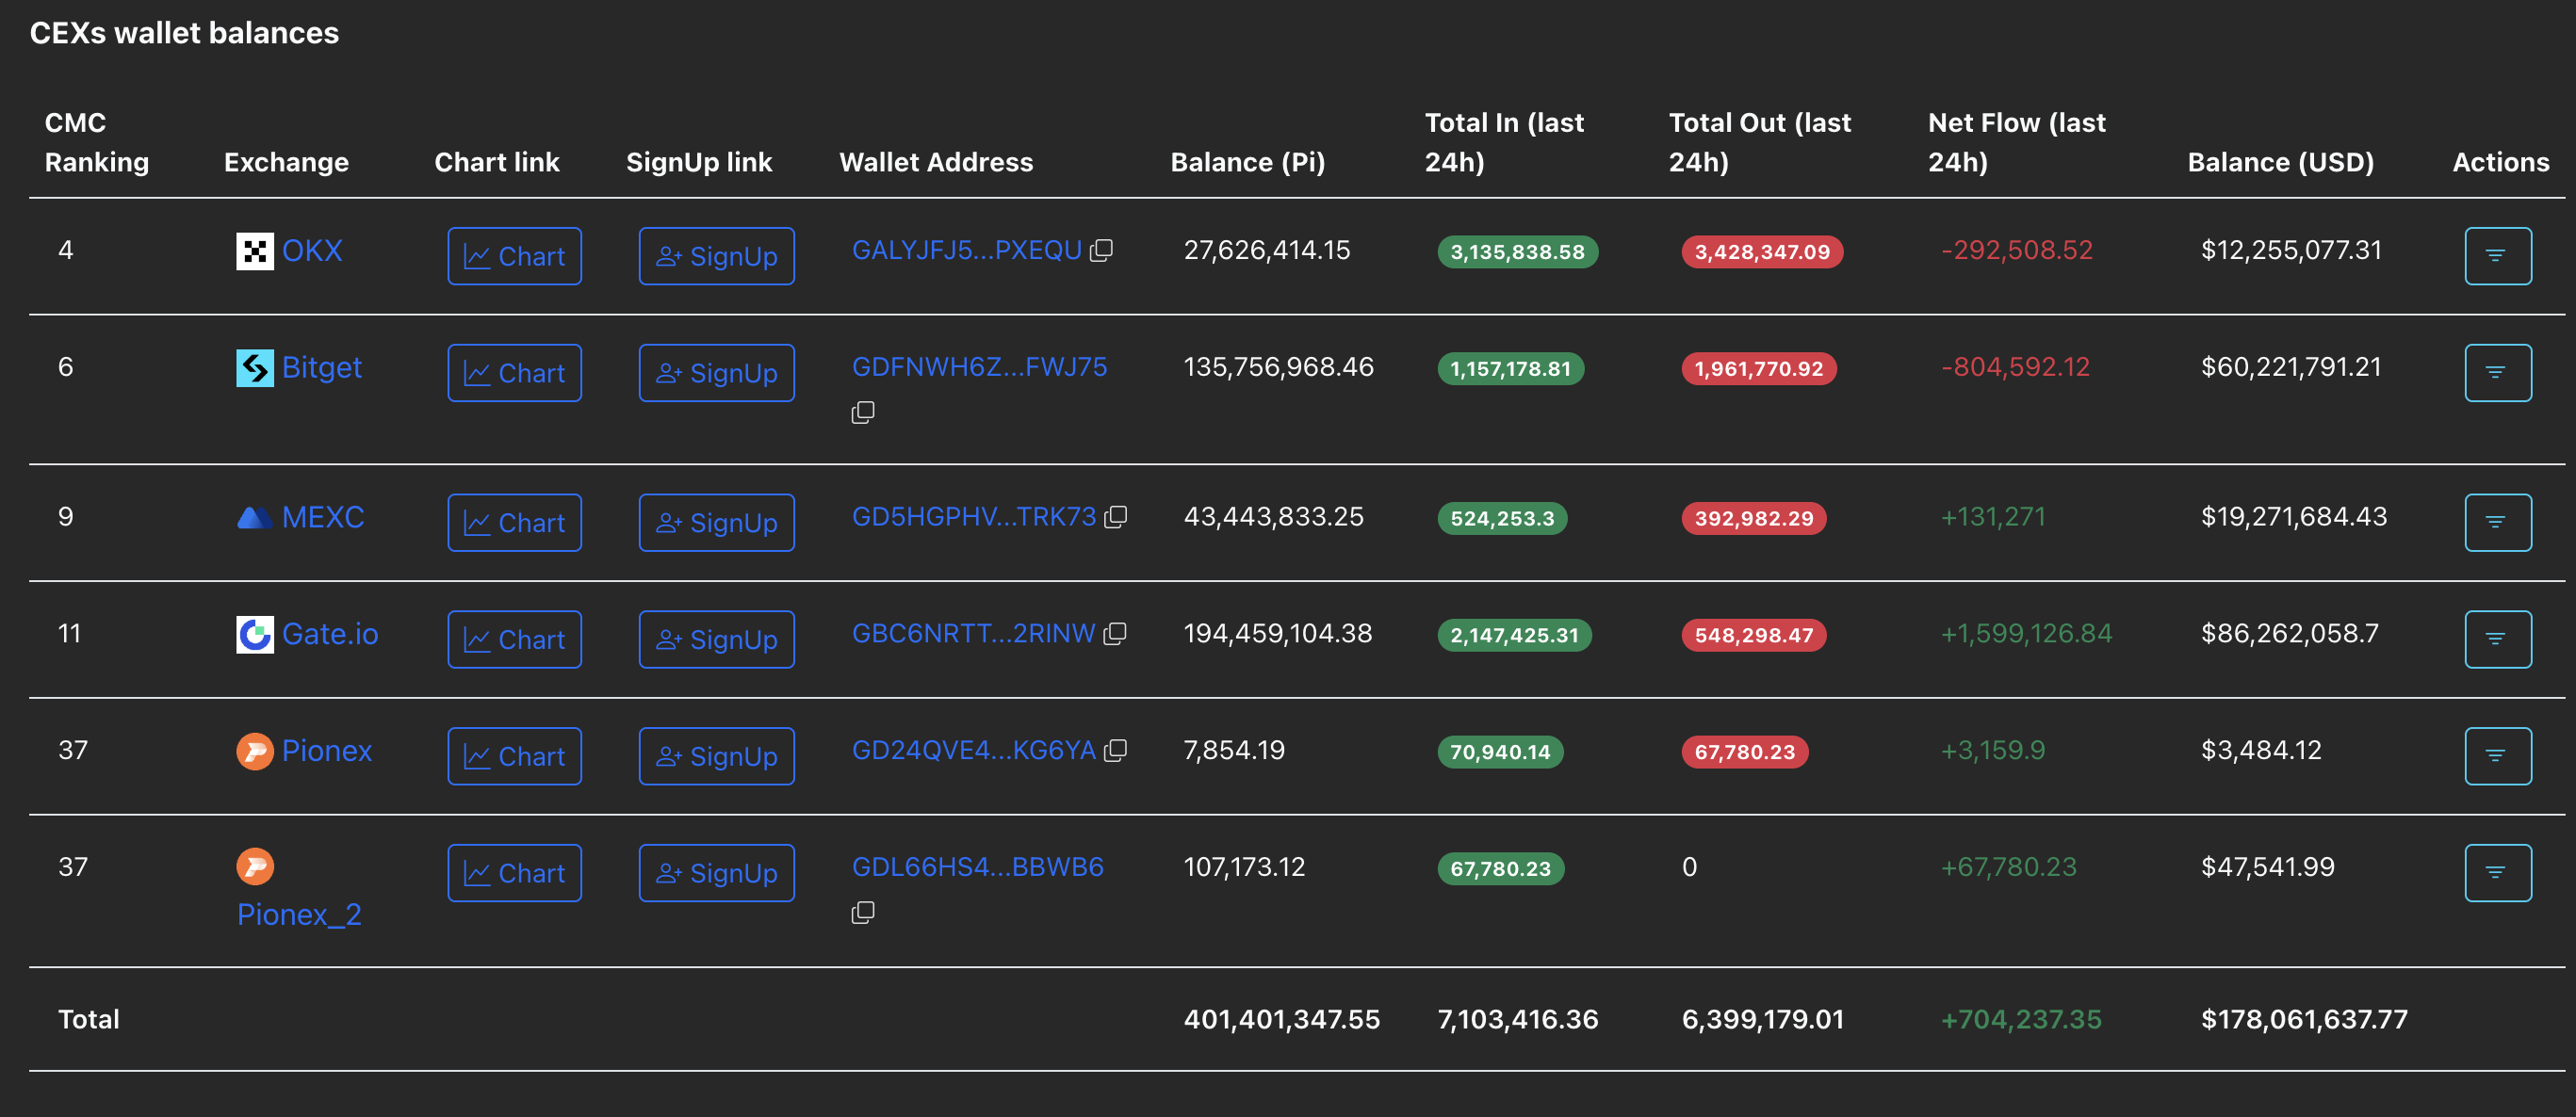
CEXs' wallet balances. Source: PiScan.
PiScan data indicates that 10.8 million PI tokens will be unlocked next Monday, the highest in the next 30 days, which accounts for a total of 171.25 million PI tokens worth $75.91 million. Typically, a surge in token unlock can fuel the selling pressure as traders may book profits.
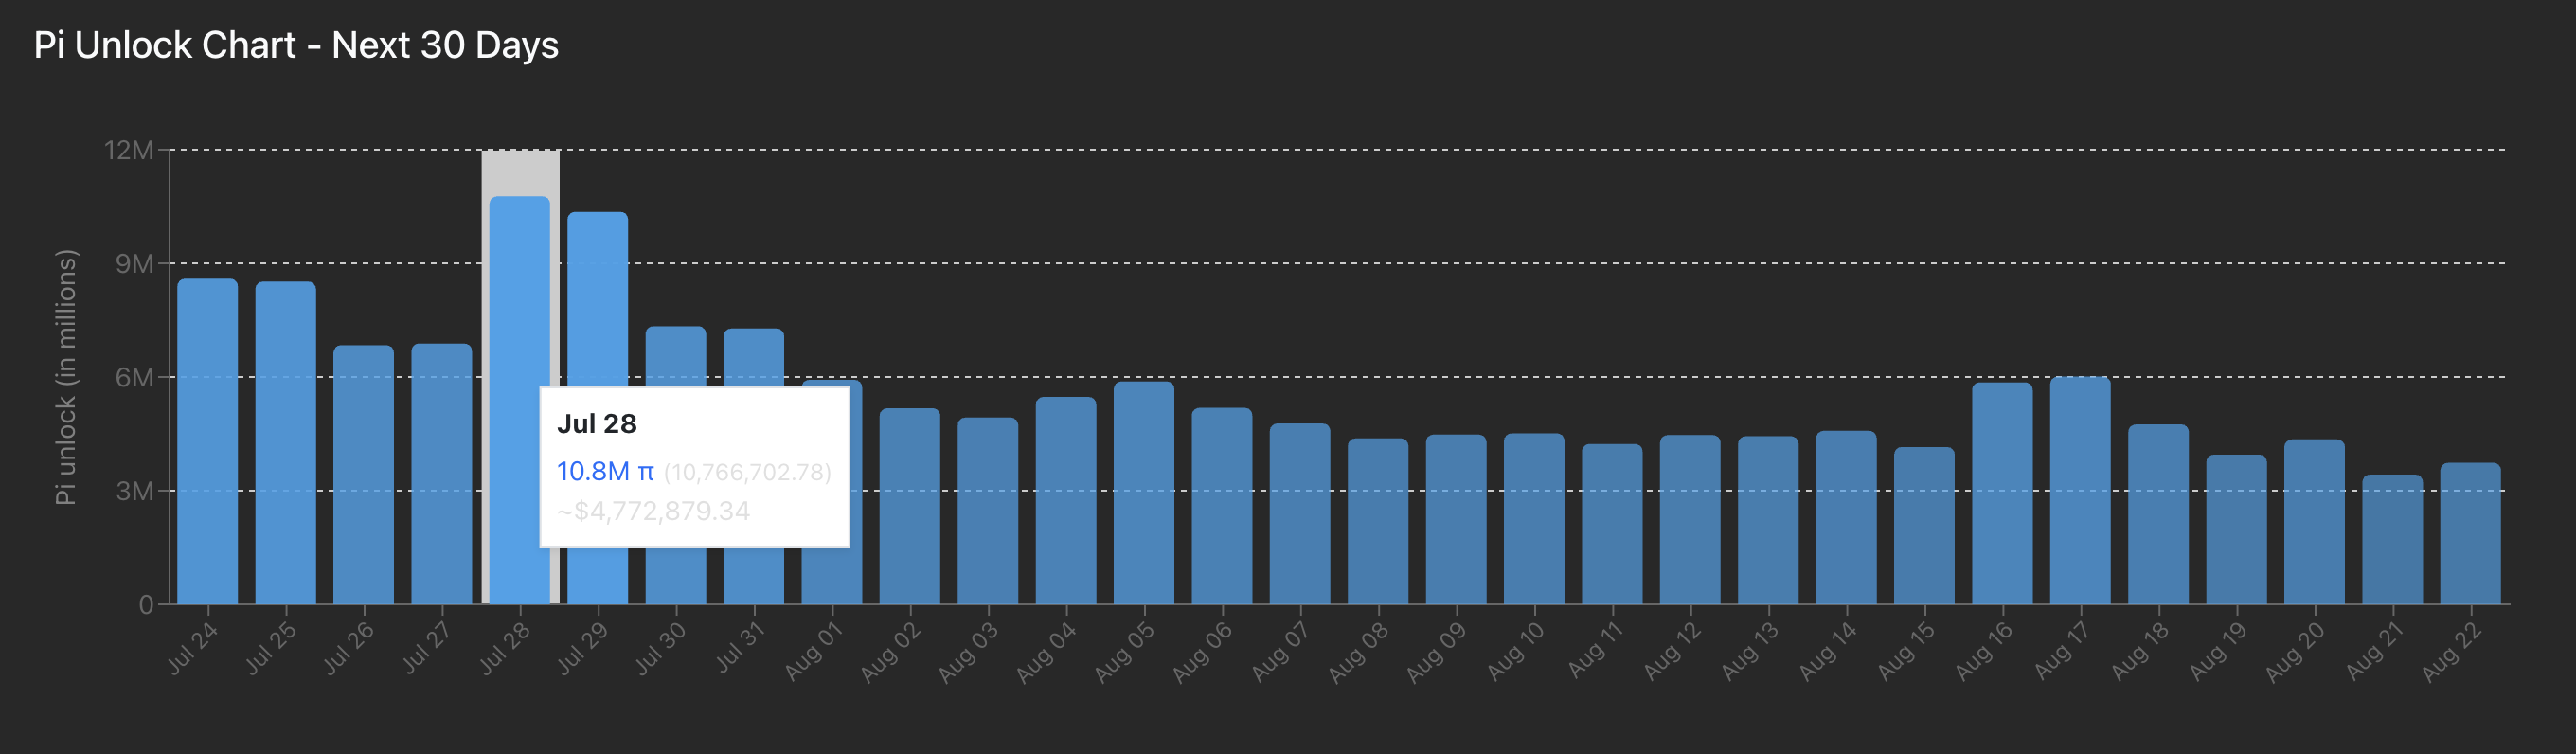
PI unlock chart. Source: PiScan.
Pi Network risks losing $0.43 support floor as bearish momentum surges
Pi Network holds above the $0.4371 support floor that previously acted as the base of a consolidation range, marked by green on the 4-hour price chart. PI struggles to float above this crucial support level with a long shadow candle, while the path of least resistance signals a downside.
A decisive close below the $0.4371 level could test the $0.4204 low marked on July 15 or the $0.4000 support, last tested on June 13.
The Moving Average Convergence Divergence (MACD) drops below the zero line as the red histogram bars intensify, signaling increased bearish momentum.
Still, the Relative Strength Index (RSI) reads 40 on the 4-hour chart, indicating a significant decline in buying pressure. A drop below 30 would indicate overbought conditions in the PI network, potentially increasing the chances of a turnaround.
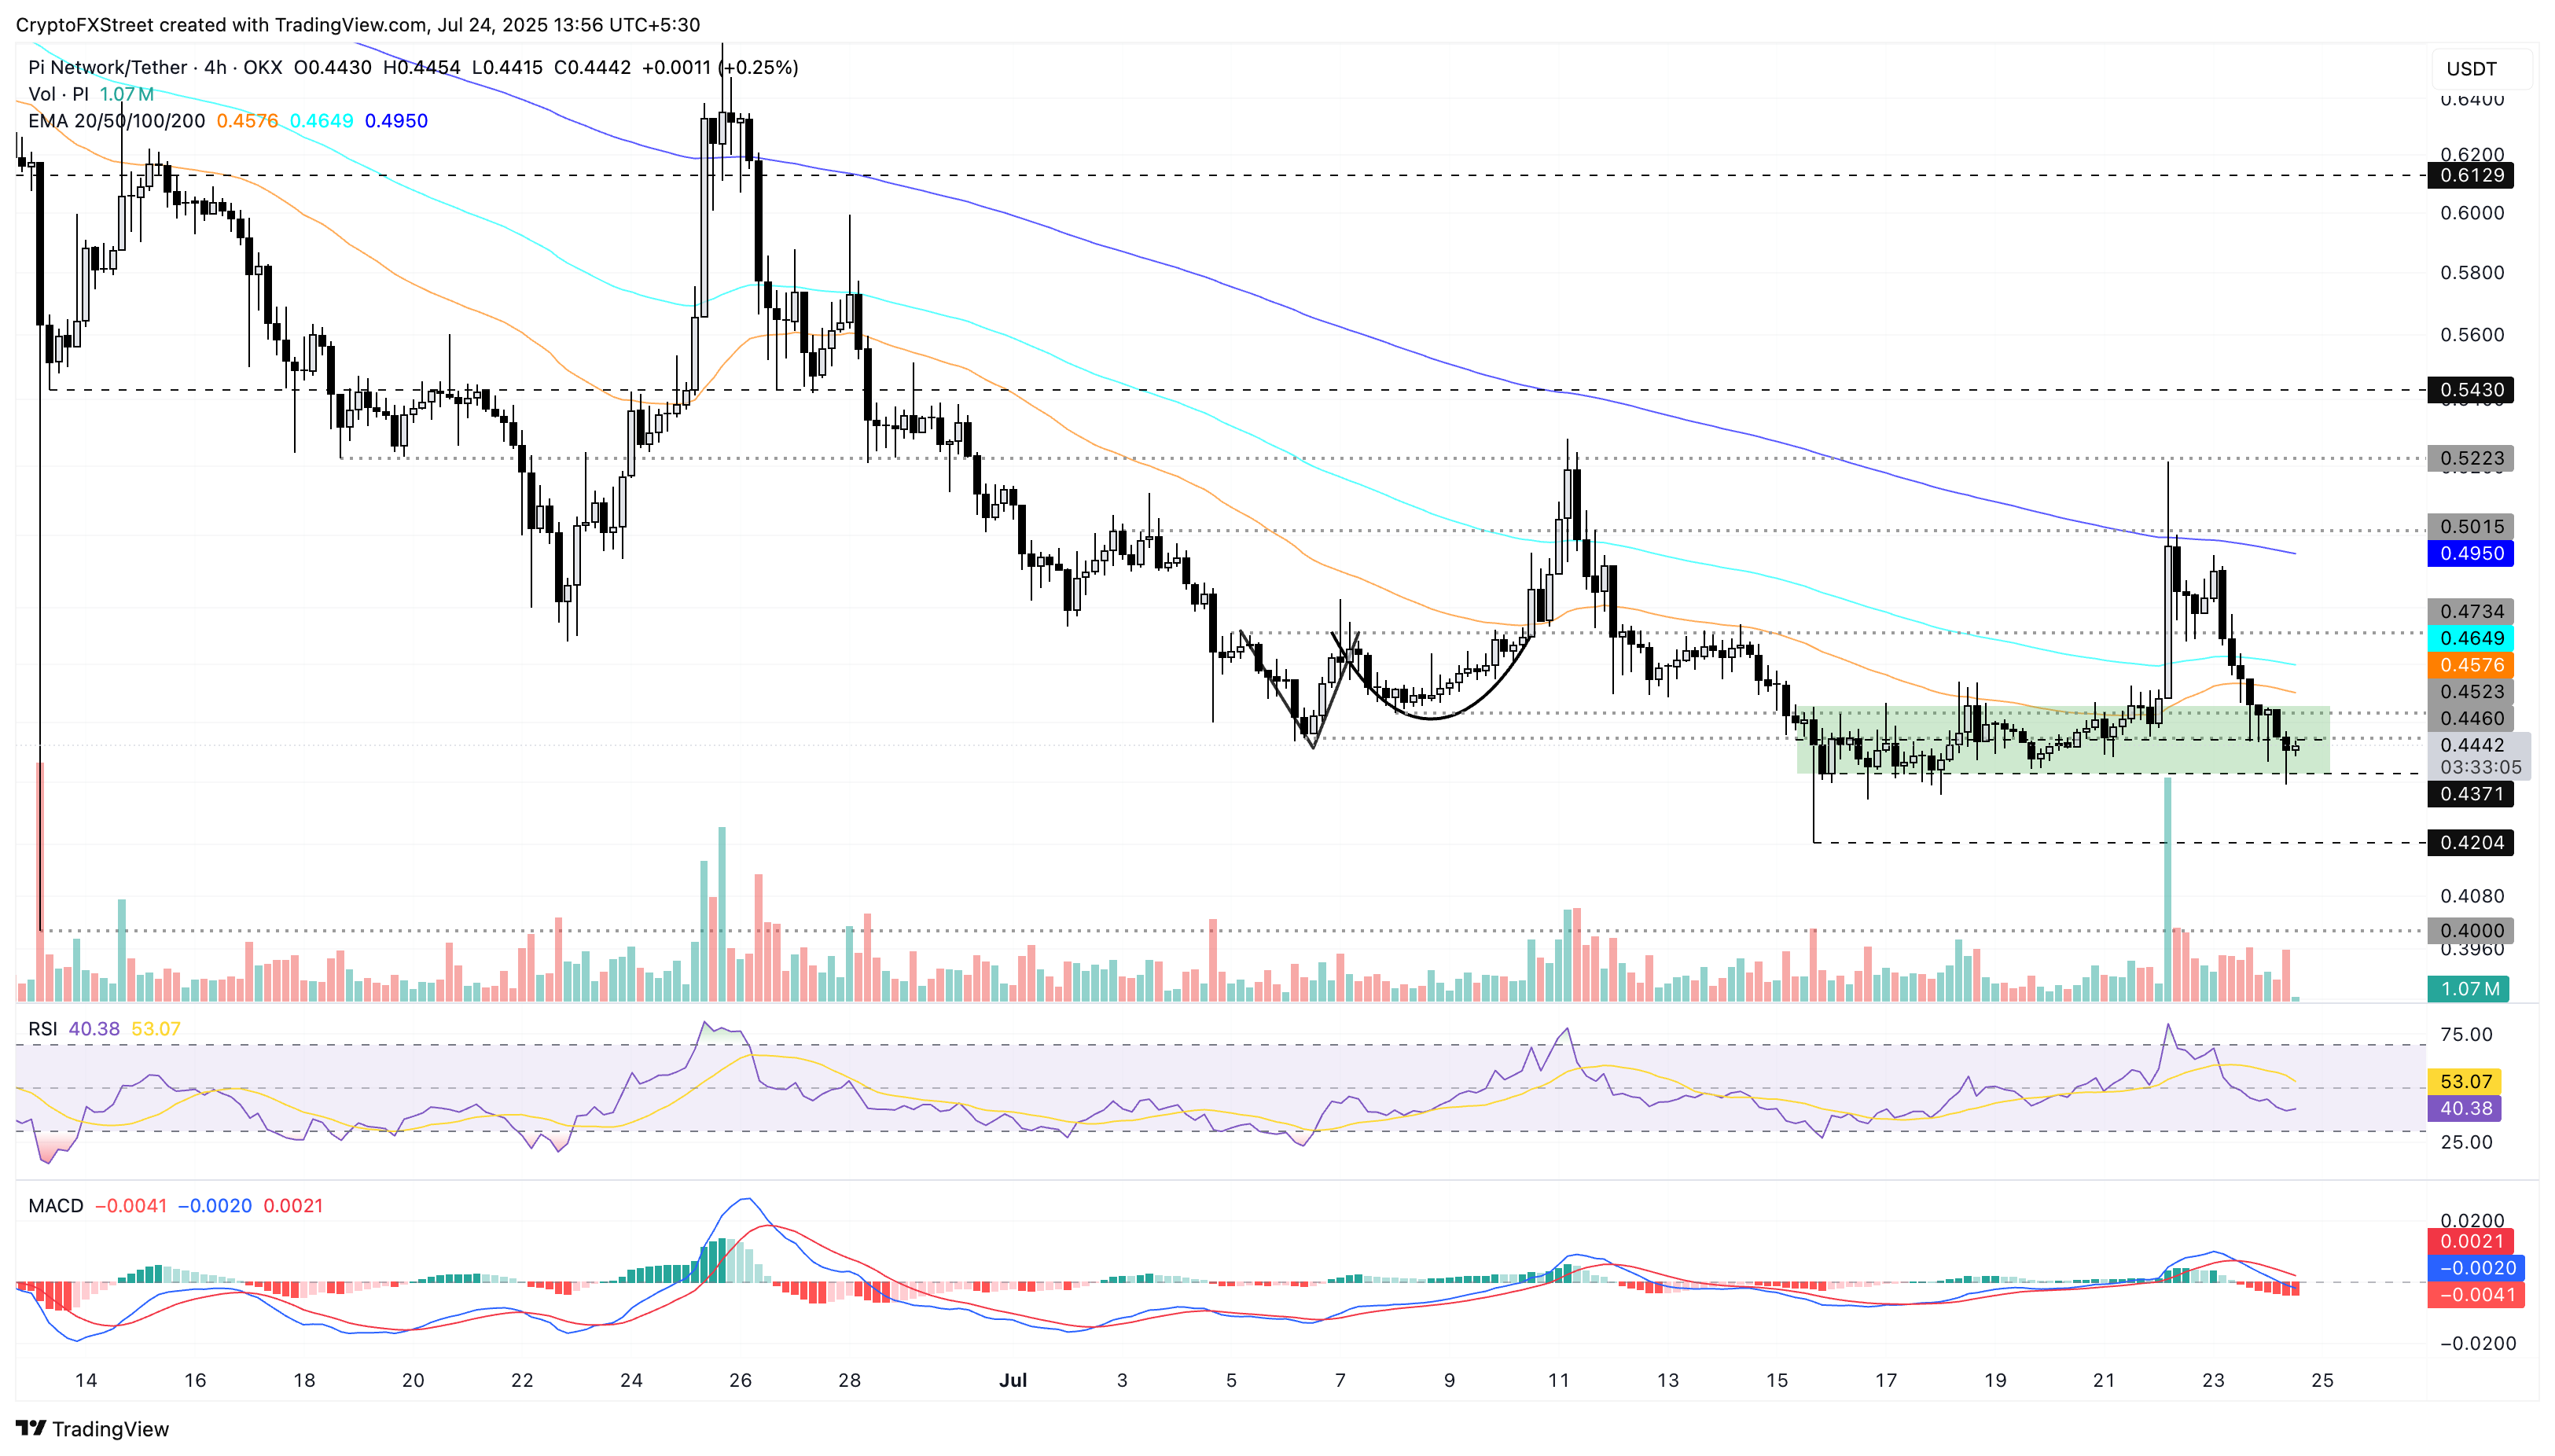
PI/USDT daily price chart.
To renew a bullish run, PI bulls must reclaim the 200-period Exponential Moving Average (EMA) at $0.4950, which could stretch the uptrend to $0.5430.
Open Interest, funding rate FAQs
Higher Open Interest is associated with higher liquidity and new capital inflow to the market. This is considered the equivalent of increase in efficiency and the ongoing trend continues. When Open Interest decreases, it is considered a sign of liquidation in the market, investors are leaving and the overall demand for an asset is on a decline, fueling a bearish sentiment among investors.
Funding fees bridge the difference between spot prices and prices of futures contracts of an asset by increasing liquidation risks faced by traders. A consistently high and positive funding rate implies there is a bullish sentiment among market participants and there is an expectation of a price hike. A consistently negative funding rate for an asset implies a bearish sentiment, indicating that traders expect the cryptocurrency’s price to fall and a bearish trend reversal is likely to occur.
Author

Vishal Dixit
FXStreet
Vishal Dixit holds a B.Sc. in Chemistry from Wilson College but found his true calling in the world of crypto.