Pi Network Price Forecast: Minor recovery in PI teases a potential trend reversal ahead
- Pi Network edges higher, gradually recovering from last week’s 12% decline.
- The launch of a new Pi Node version aims to improve the node initialization process.
- Technicals share a bullish bias as PI nears the breakout of an Adam and Eve pattern on the 4-hour chart.

Pi Network (PI) edges higher at press time on Thursday as it trades in the green for the third consecutive day. The recovery could have been driven by the launch of the new Pi Node version, while the technical outlook shares the possibility of extended gains with a bullish pattern breakout.
Pi nodes remain concentrated amid new version launch
Pi nodes are devices connected to the Pi Network that contribute to its decentralization, security, and transaction verification. On Thursday, the 0.5.3 version of the Pi Node was launched, with a focus on improving the robustness of node initialization.
PiScan data shows 99 active nodes in the network on Thursday, with South Korea leading the way with 23 connected nodes. However, with a total of 10 validators and 792 known peers, Pi Network lags in decentralization.
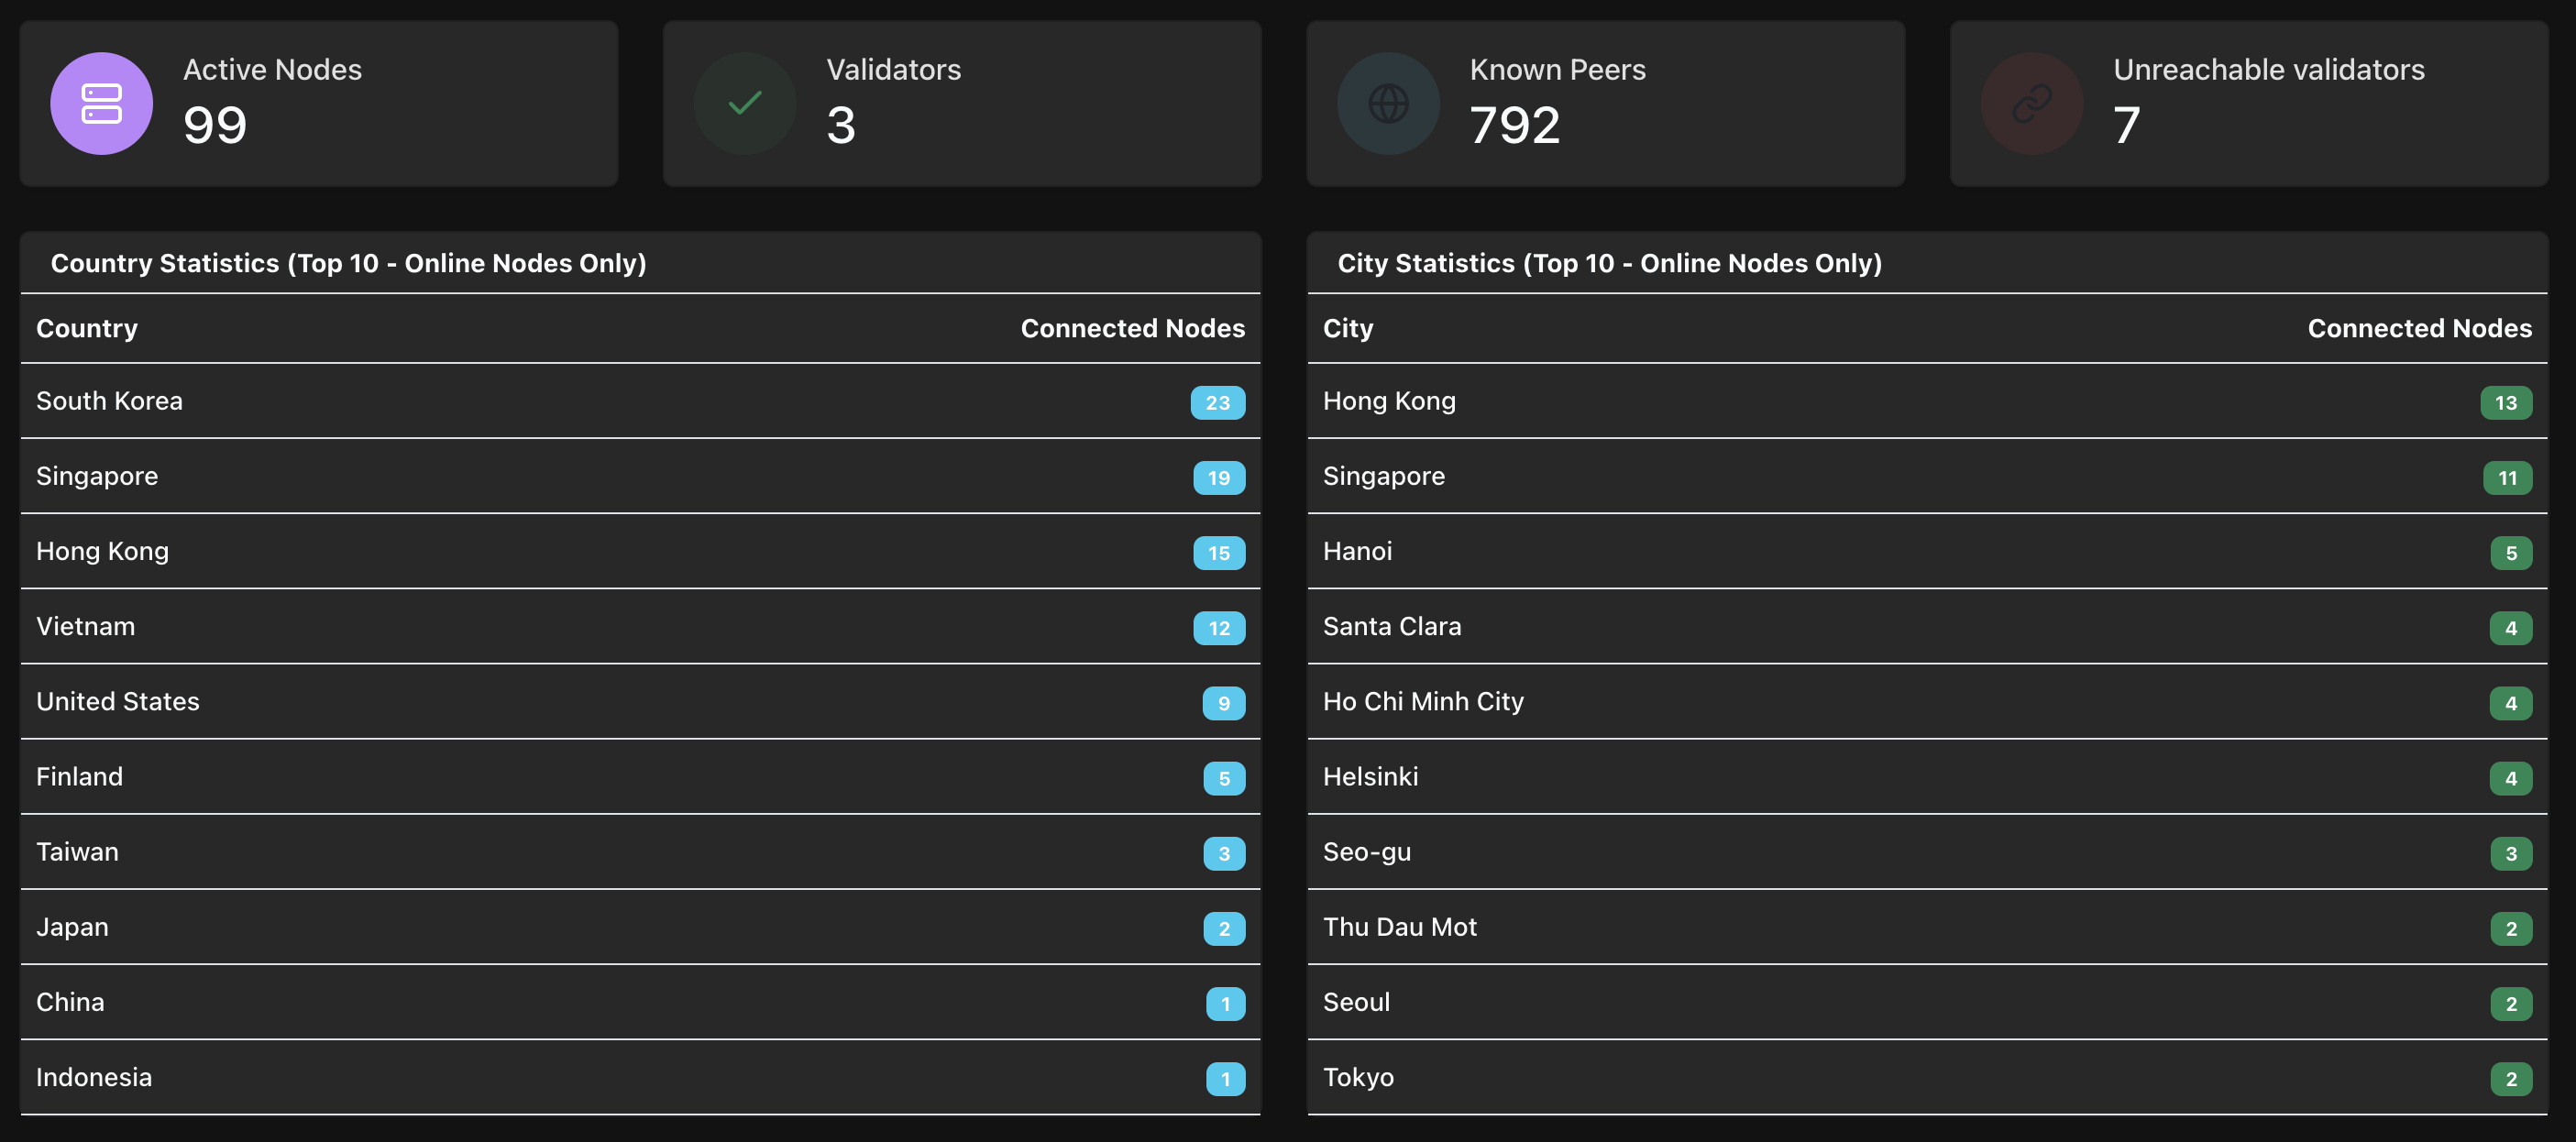
Pi Nodes. Source: PiScan
Pi Network eyes further gains as it nears a pattern breakout
Pi Network edges higher at press time on Thursday, inching closer to the $0.50 psychological level. The recovery in PI exceeds the $0.4734 resistance, which serves as the neckline of an Adam and Eve pattern, as illustrated in the 4-hour chart below.
Typically, the Adam and Eve pattern signals a bullish reversal after a prevailing downtrend. A potential daily close above $0.4734 level would release the trapped bullish momentum within the pattern.
A potential uptrend in Pi Network could target the $0.5015 level, last tested on July 3.
The technical indicators on the 4-hour chart indicate a surge in bullish momentum, as the Moving Average Convergence/Divergence (MACD) indicator displays a series of green histograms rising above the zero line.
Additionally, the Relative Strength Index (RSI) reads 62, inching closer to the overbought zone. Sidelined investors must remain cautious, as the indicators in the 4-hour chart could experience sharp reversals.
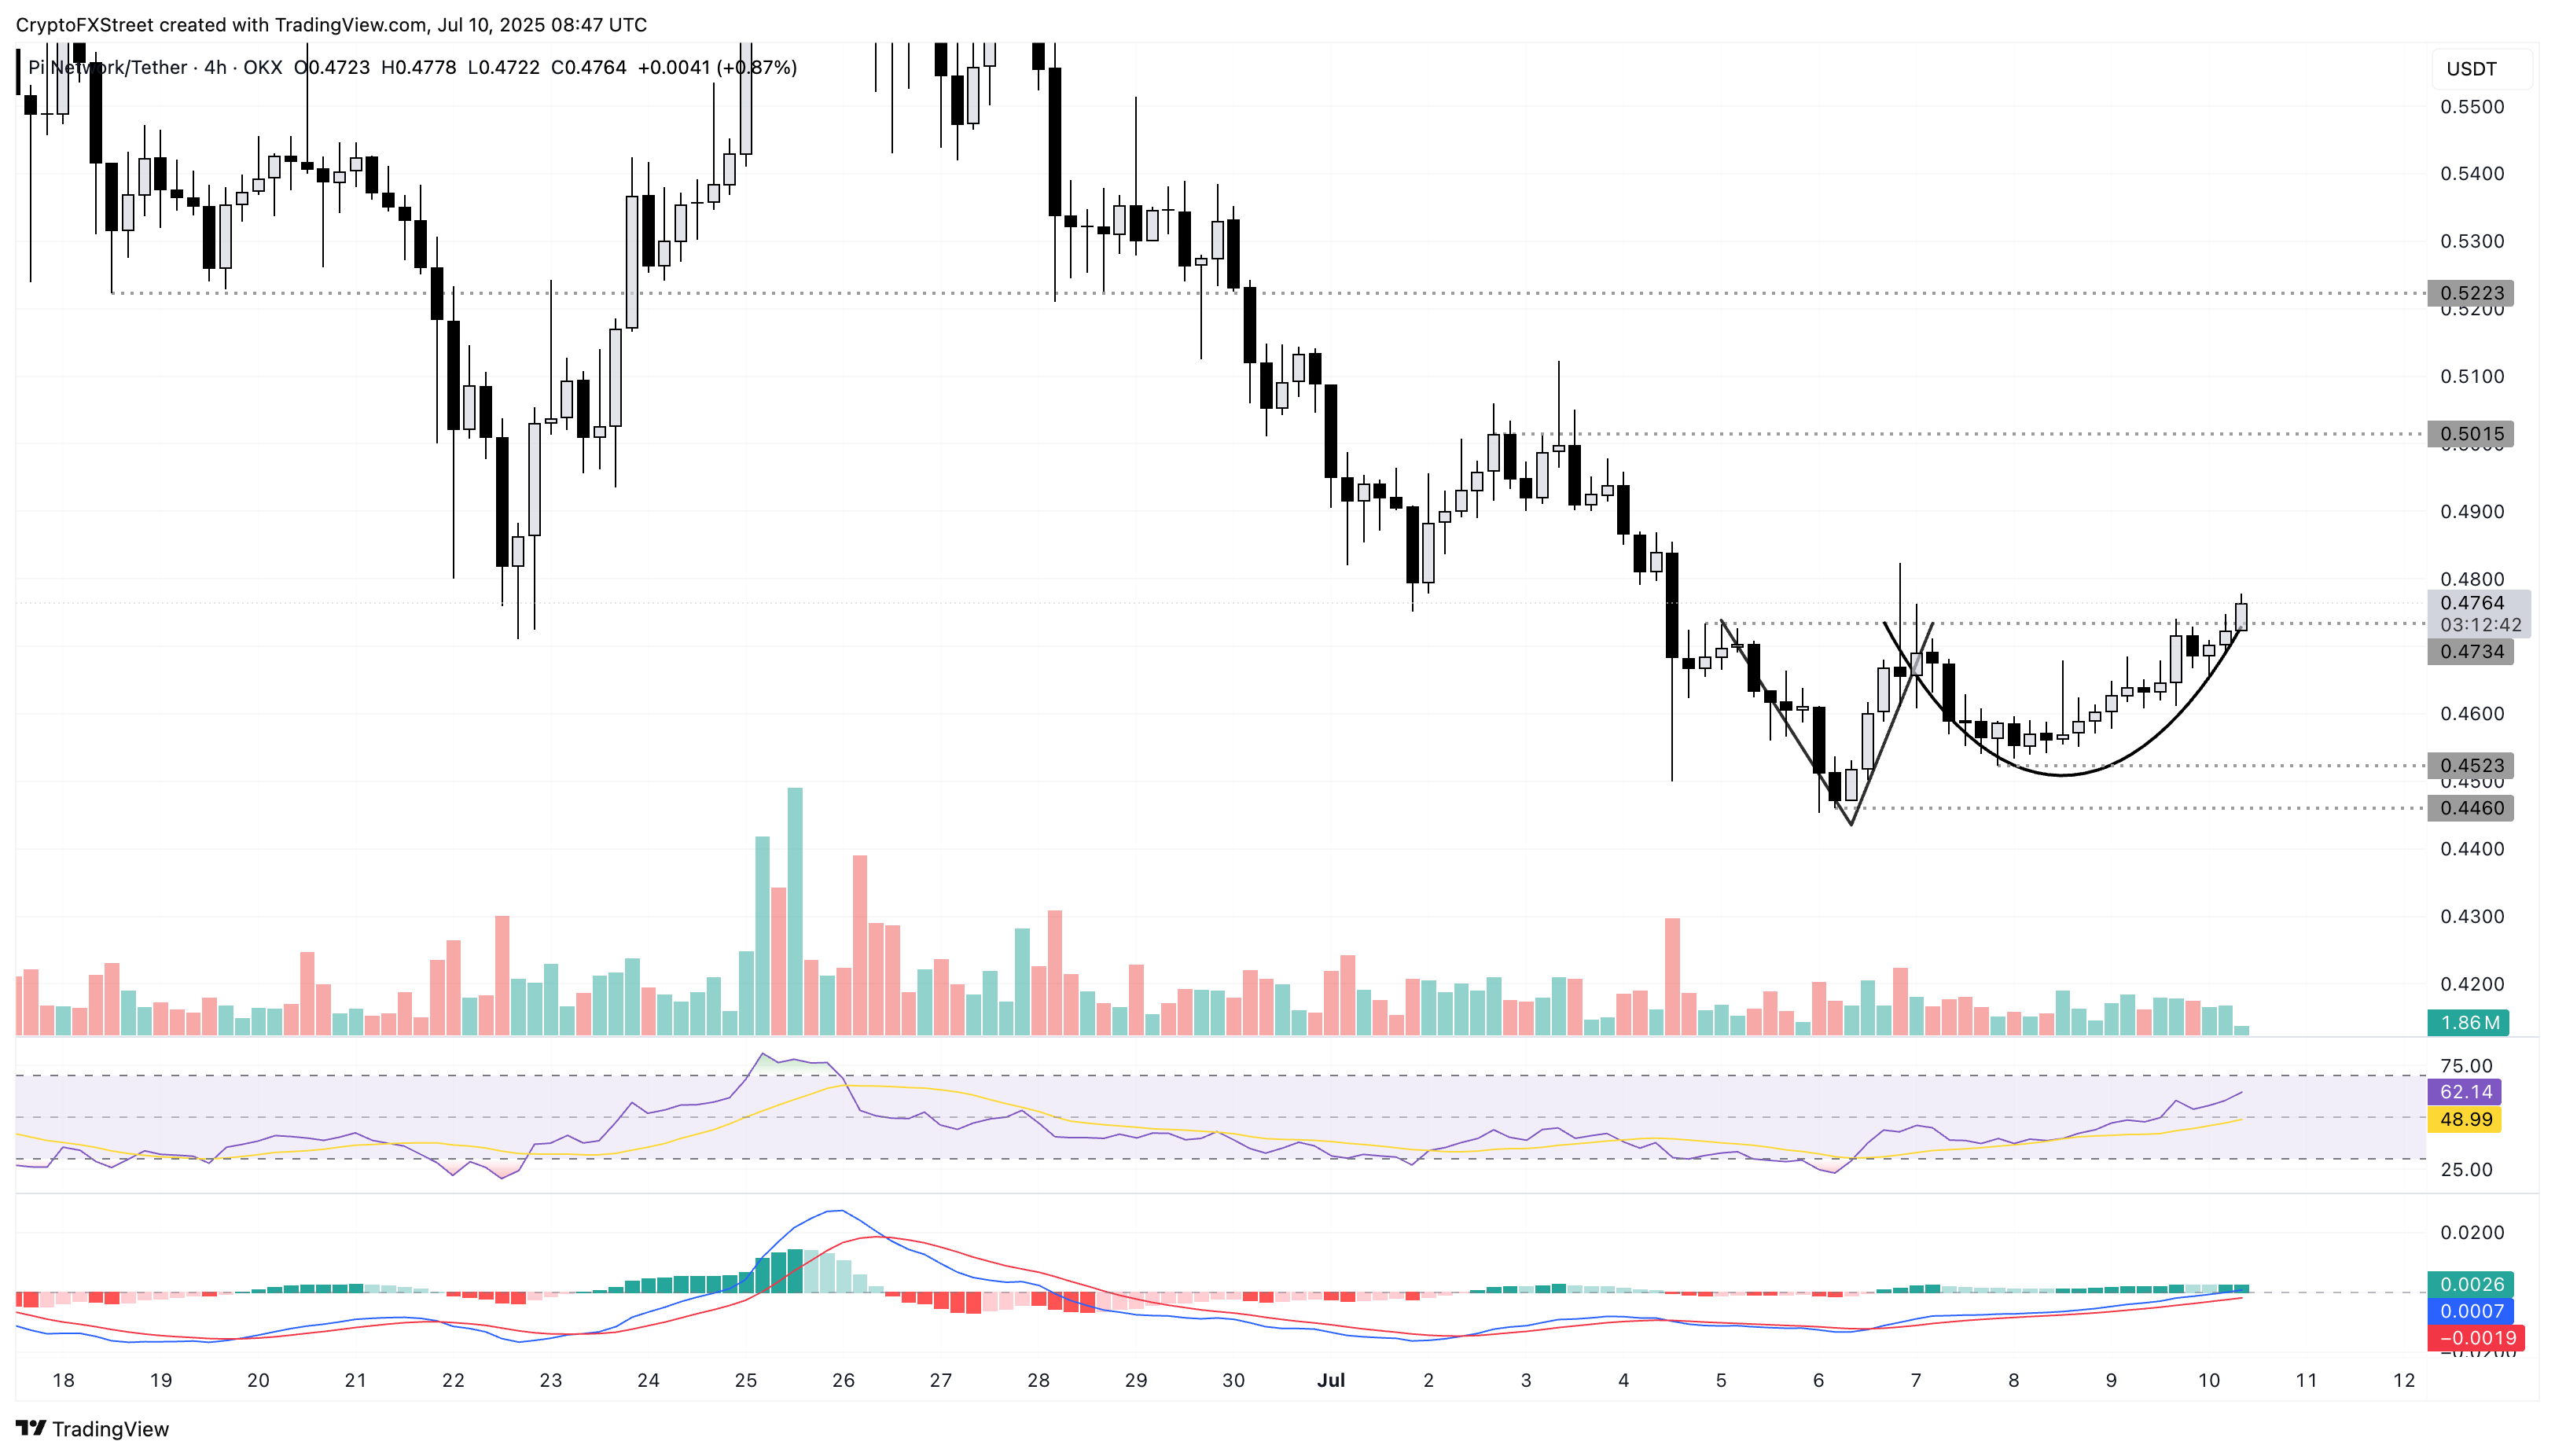
PI/USDT daily price chart.
On the downside, a reversal in PI from the $0.4734 resistance could result in a retest of the $0.4523 level, marked by the low of July 7.
Open Interest, funding rate FAQs
Higher Open Interest is associated with higher liquidity and new capital inflow to the market. This is considered the equivalent of increase in efficiency and the ongoing trend continues. When Open Interest decreases, it is considered a sign of liquidation in the market, investors are leaving and the overall demand for an asset is on a decline, fueling a bearish sentiment among investors.
Funding fees bridge the difference between spot prices and prices of futures contracts of an asset by increasing liquidation risks faced by traders. A consistently high and positive funding rate implies there is a bullish sentiment among market participants and there is an expectation of a price hike. A consistently negative funding rate for an asset implies a bearish sentiment, indicating that traders expect the cryptocurrency’s price to fall and a bearish trend reversal is likely to occur.
Author

Vishal Dixit
FXStreet
Vishal Dixit holds a B.Sc. in Chemistry from Wilson College but found his true calling in the world of crypto.


