Pi Network Price Forecast: Whales challenge rising supply pressure with 2 million PI token purchase
- Pi Network edges lower, extending the previous week’s downfall below $0.50.
- Top whales bought over 2 million PI tokens, while CEXs' wallet balances grow.
- The technical outlook shows a bearish bias, suggesting a potential retest of $0.40 as bullish momentum fades.
Pi Network (PI) edges lower by nearly 1% and trades at $0.45 at press time on Tuesday as the available wallet balance of centralized exchanges (CEX) grows, suggesting increased supply pressure. However, the large transactions over the last 24 hours reveal two whale transactions acquiring over 2 million PI tokens. Still, the technical outlook suggests a bearish bias, indicating a potential retest of the $0.40 mark.
Whales are on a buying spree amid rising CEX levels
PiScan's data shows the CEXs’ wallet balances rising to 373.60 million PI tokens with a net inflow of 2.41 million PI tokens in the last 24 hours. The rising deposits on CEX suggest increased selling pressure from investors.
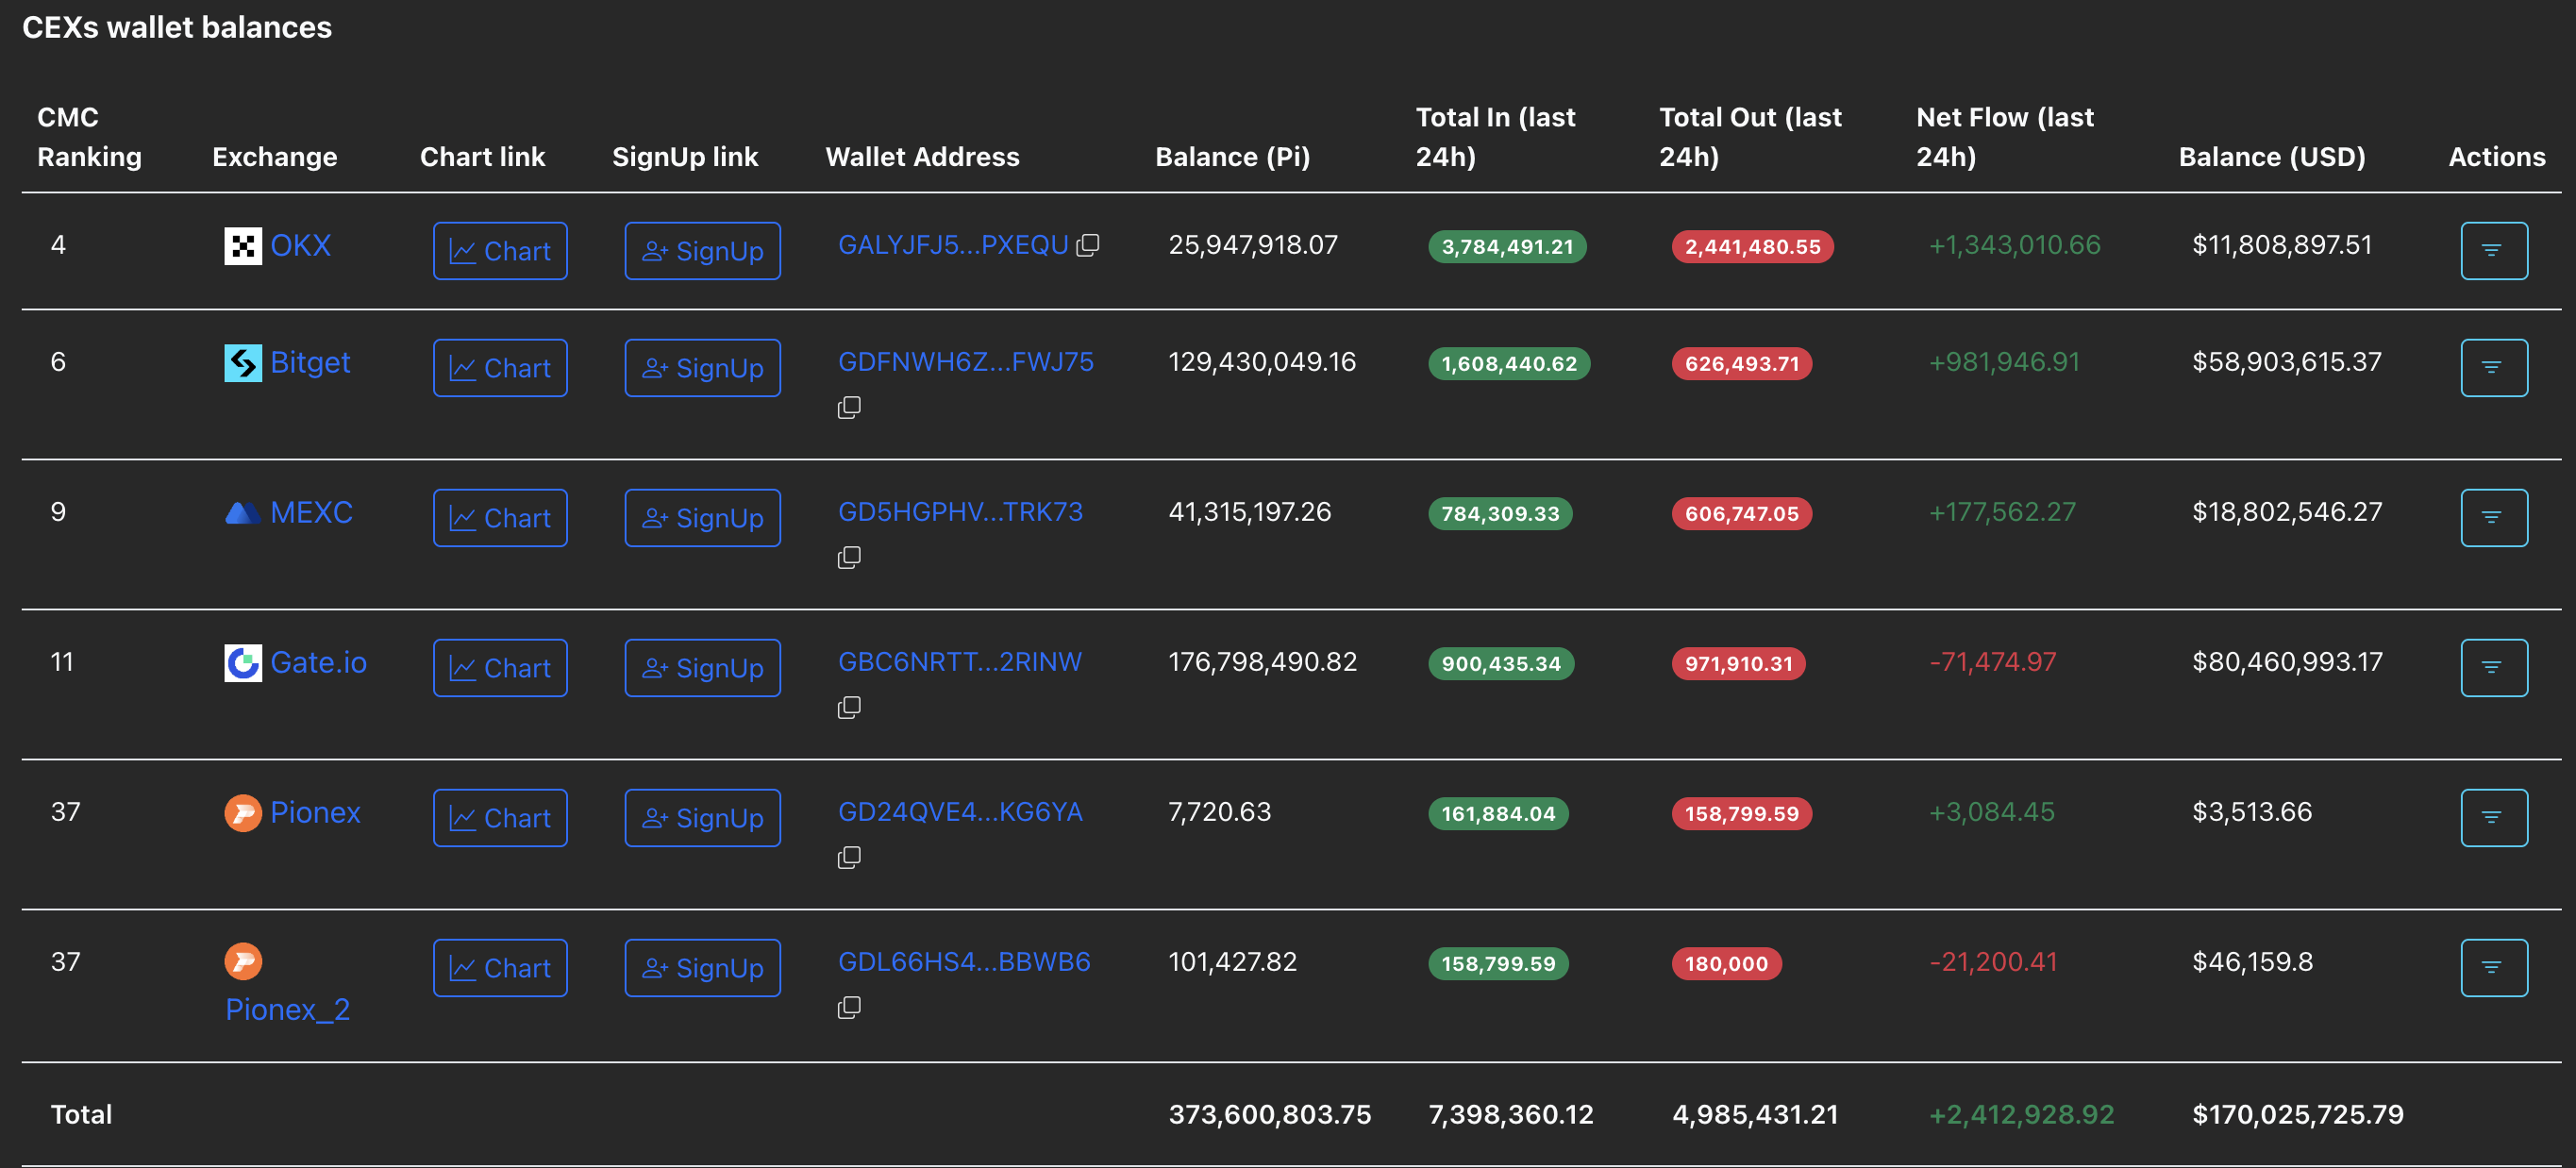
CEXs' wallet balances. Source: PiScan
Amid the rising supply pressure, the large transactions over the last 24 hours highlight two whale transactions withdrawing over 2 million PI tokens from the OKX exchange. The “GASWBD…J2AODM” withdrew 1.66 million PI tokens, while the “GBVD3M…4ZLRVM” acquired 400,000 PI tokens. It is worth noting that the whale "GASWBD…J2AODM" has acquired 7.92 million PI tokens in the last five days.
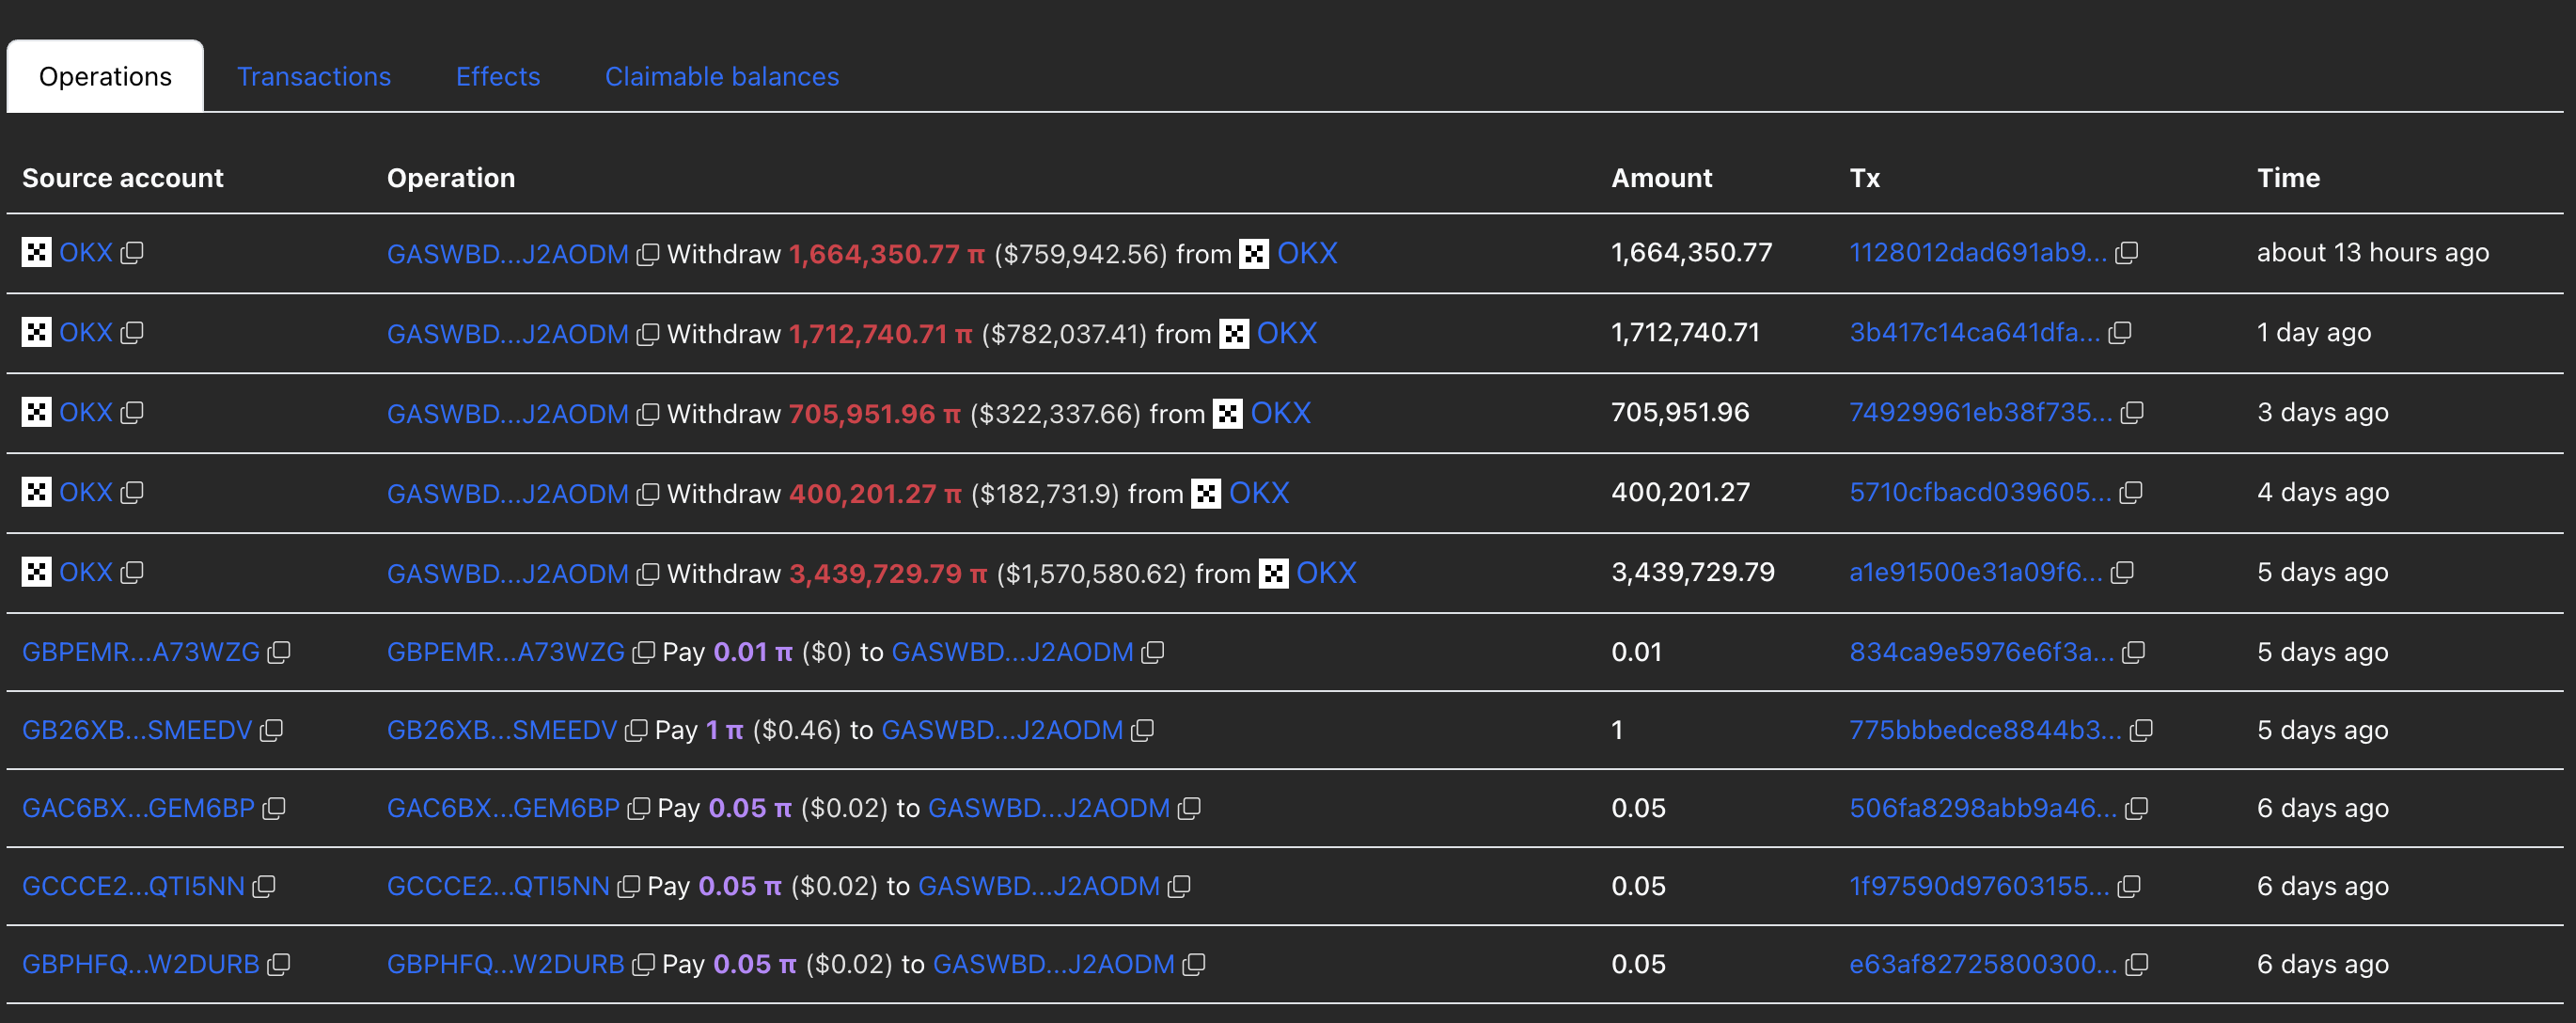
Pi whale's account overview. Source: PiScan
The whales’ purchases almost match the total supply inflow of all exchanges, suggesting heightened confidence.
Pi Network eyes $0.40 retest as bullish momentum fades
Pi Network ticks lower by nearly 1% at press time on Tuesday following Monday's decline. As PI extends the 12% drop from last week, the declining trend eyes the $0.40 round figure, last tested on June 13.
The technical indicators remain muted, with the Relative Strength Index (RSI) hovering around 33 on the daily chart, slightly above the oversold boundary. A dip below the oversold boundary at 30 would signal increased selling pressure.
The Moving Average Convergence/Divergence (MACD) indicator displays a declining trend in the MACD and signal lines in the negative territory. Still, a decrease in red histogram bars hints at a potential crossover, which sidelined investors could consider a buy signal.
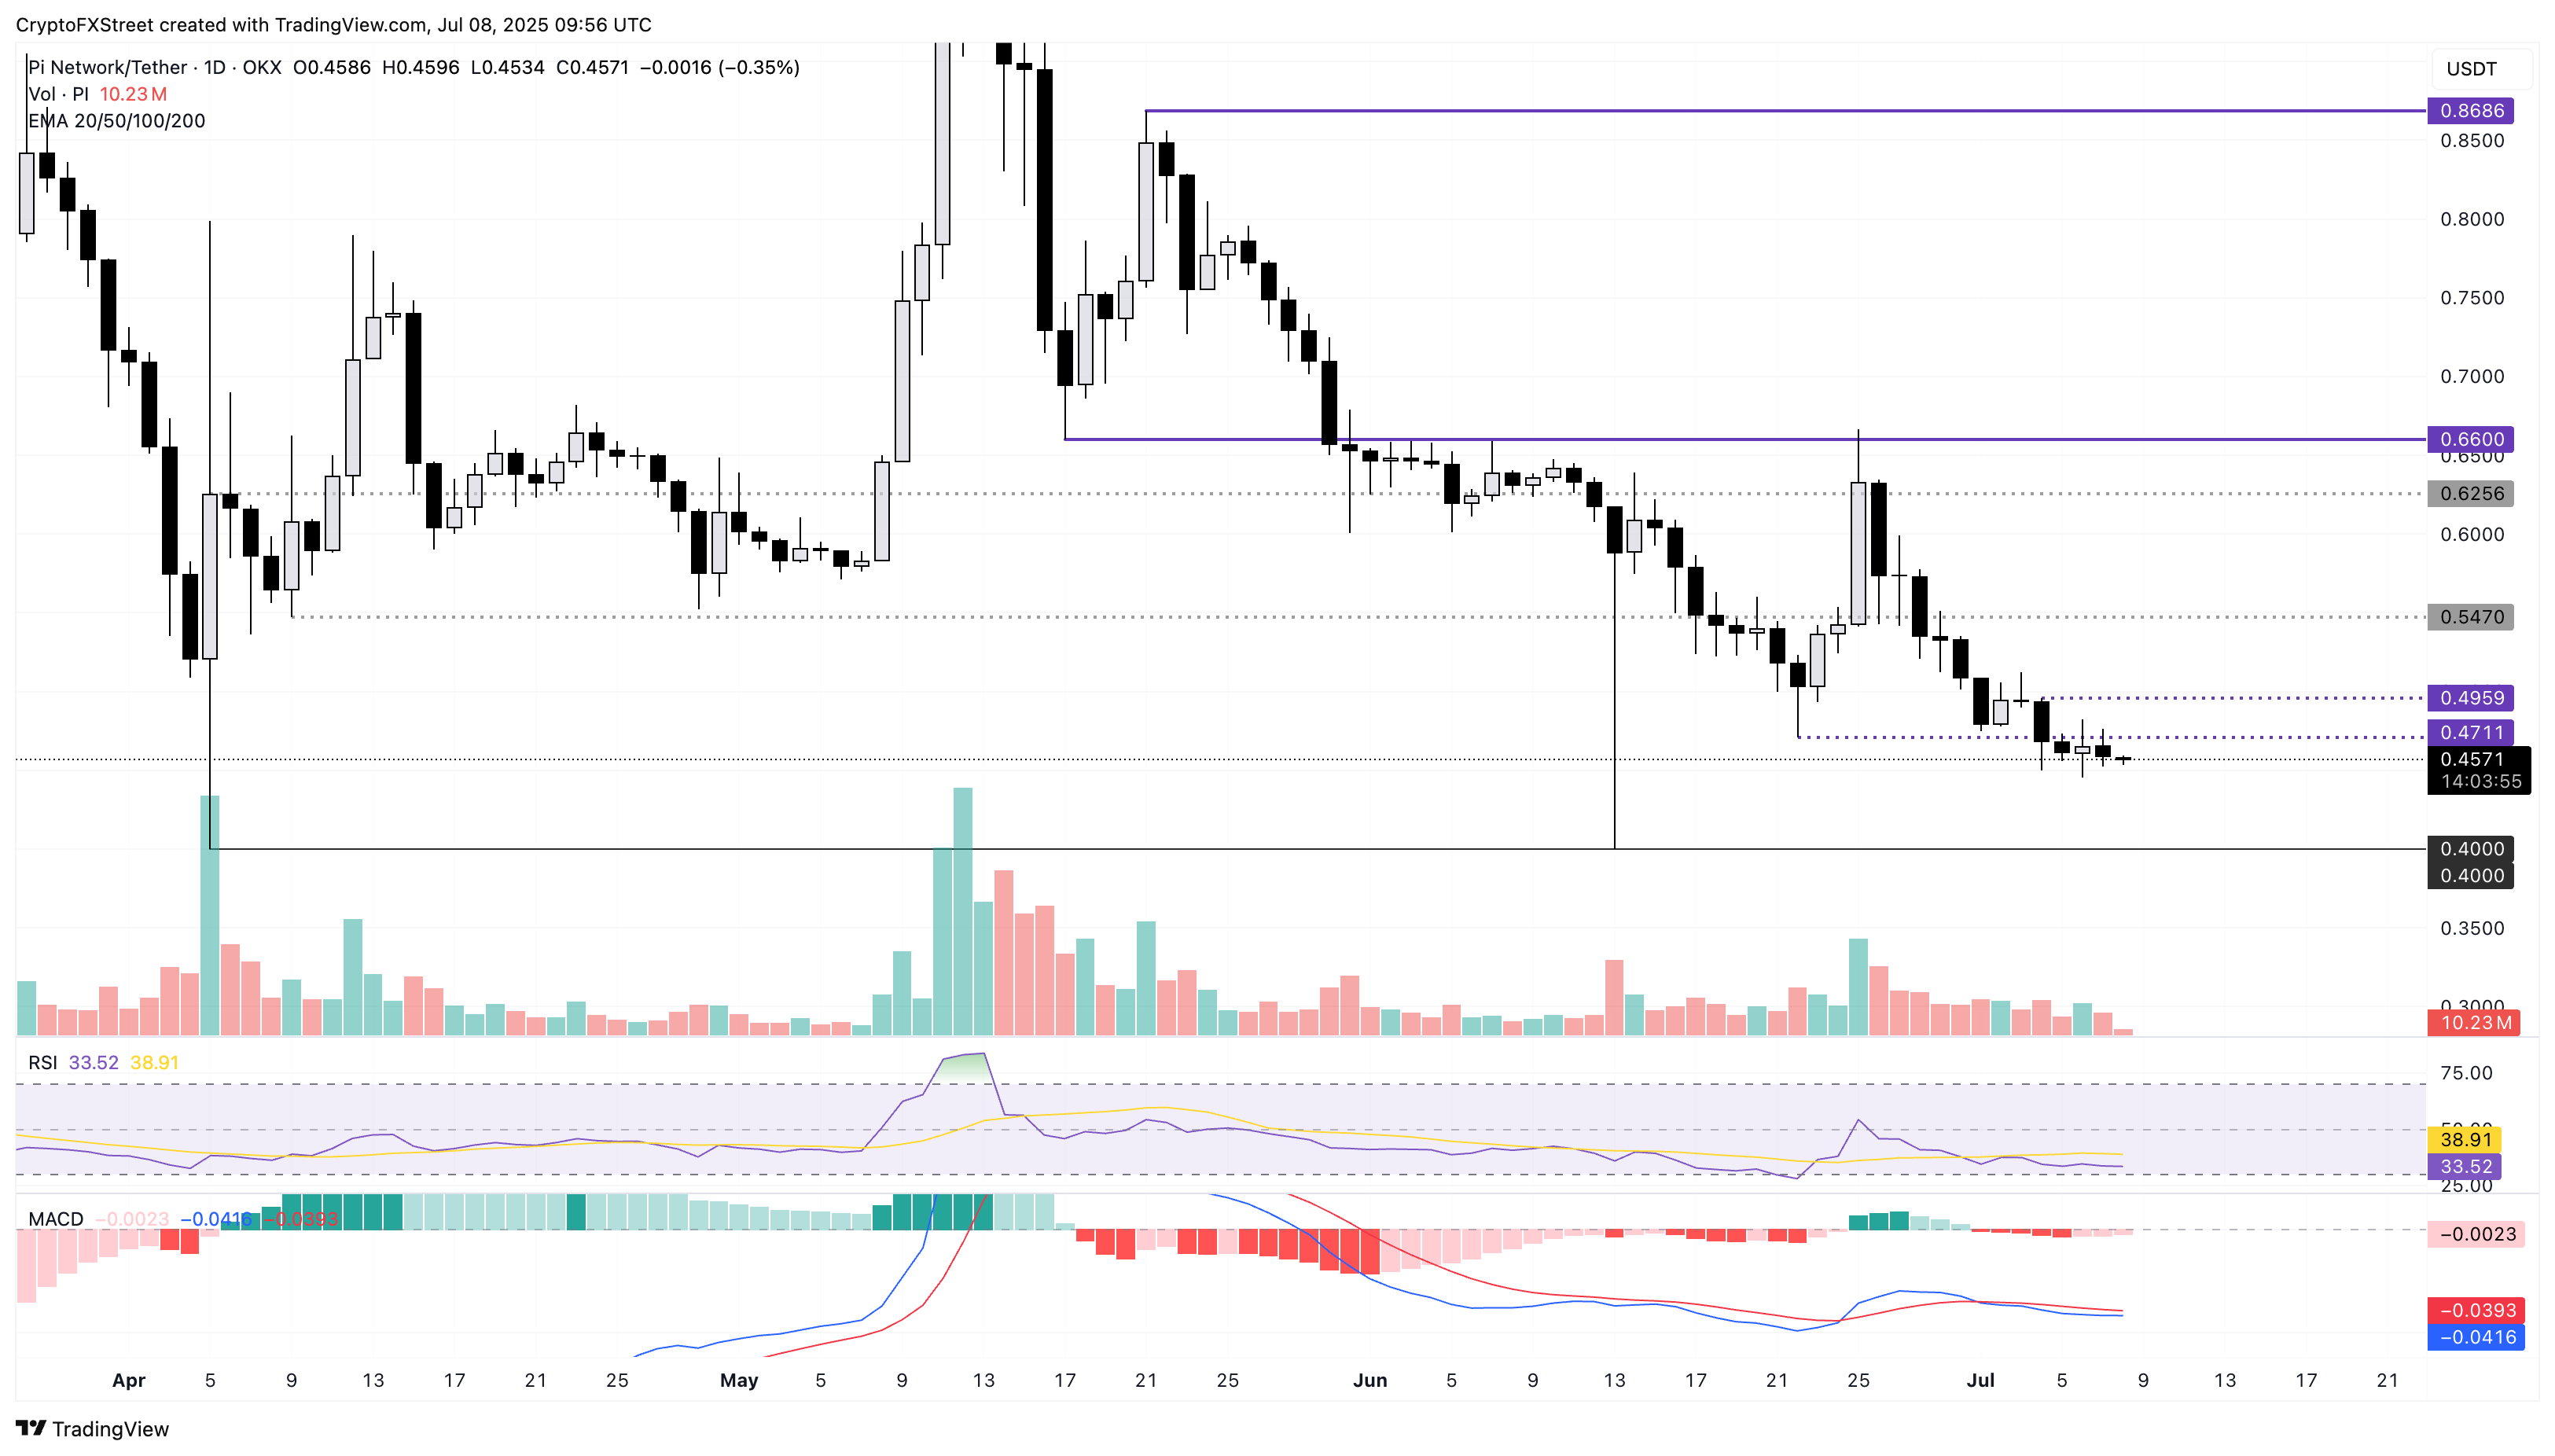
PI/USDT daily price chart.
However, to restart an uptrend, Pi Network must overcome Friday's bearish candle with a daily close above the $0.50 psychological mark. In such a scenario, the uptrend in PI could reach the $0.54 mark last tested on June 29.
Open Interest, funding rate FAQs
Higher Open Interest is associated with higher liquidity and new capital inflow to the market. This is considered the equivalent of increase in efficiency and the ongoing trend continues. When Open Interest decreases, it is considered a sign of liquidation in the market, investors are leaving and the overall demand for an asset is on a decline, fueling a bearish sentiment among investors.
Funding fees bridge the difference between spot prices and prices of futures contracts of an asset by increasing liquidation risks faced by traders. A consistently high and positive funding rate implies there is a bullish sentiment among market participants and there is an expectation of a price hike. A consistently negative funding rate for an asset implies a bearish sentiment, indicating that traders expect the cryptocurrency’s price to fall and a bearish trend reversal is likely to occur.
Author

Vishal Dixit
FXStreet
Vishal Dixit holds a B.Sc. in Chemistry from Wilson College but found his true calling in the world of crypto.


