Pi Network Price Forecast: Bulls under pressure as PI retests a falling channel breakout
- Pi Network holds above $0.3500 as a channel breakout rally reverses.
- Crypto Fear and Greed Index remains neutral ahead of the US Federal Reserve's decision on Wednesday.
- The technical outlook suggests PI is at a crucial crossroads as bullish momentum holds.

Pi Network (PI) price is currently holding above $0.3500 level at press time on Tuesday, struggling to enforce a channel breakout rally. The technical outlook indicates that the PI token is standing at a crucial crossroads as the market sentiment ahead of the US Federal Open Market Committee (FOMC) meeting, which will decide on interest rate cuts on Wednesday, remains muted.
Market sentiment at hold
The broader cryptocurrency market sentiment remains steady, anticipating a potential 25 basis points rate cut at the US FOMC meeting on Wednesday. CoinMarketCap’s Crypto Fear and Greed Index at 50 remains neutral, suggesting that the investors are taking a wait-and-see approach. Such a period of stillness in market activity puts the Pi Network at risk of losing bullish momentum.
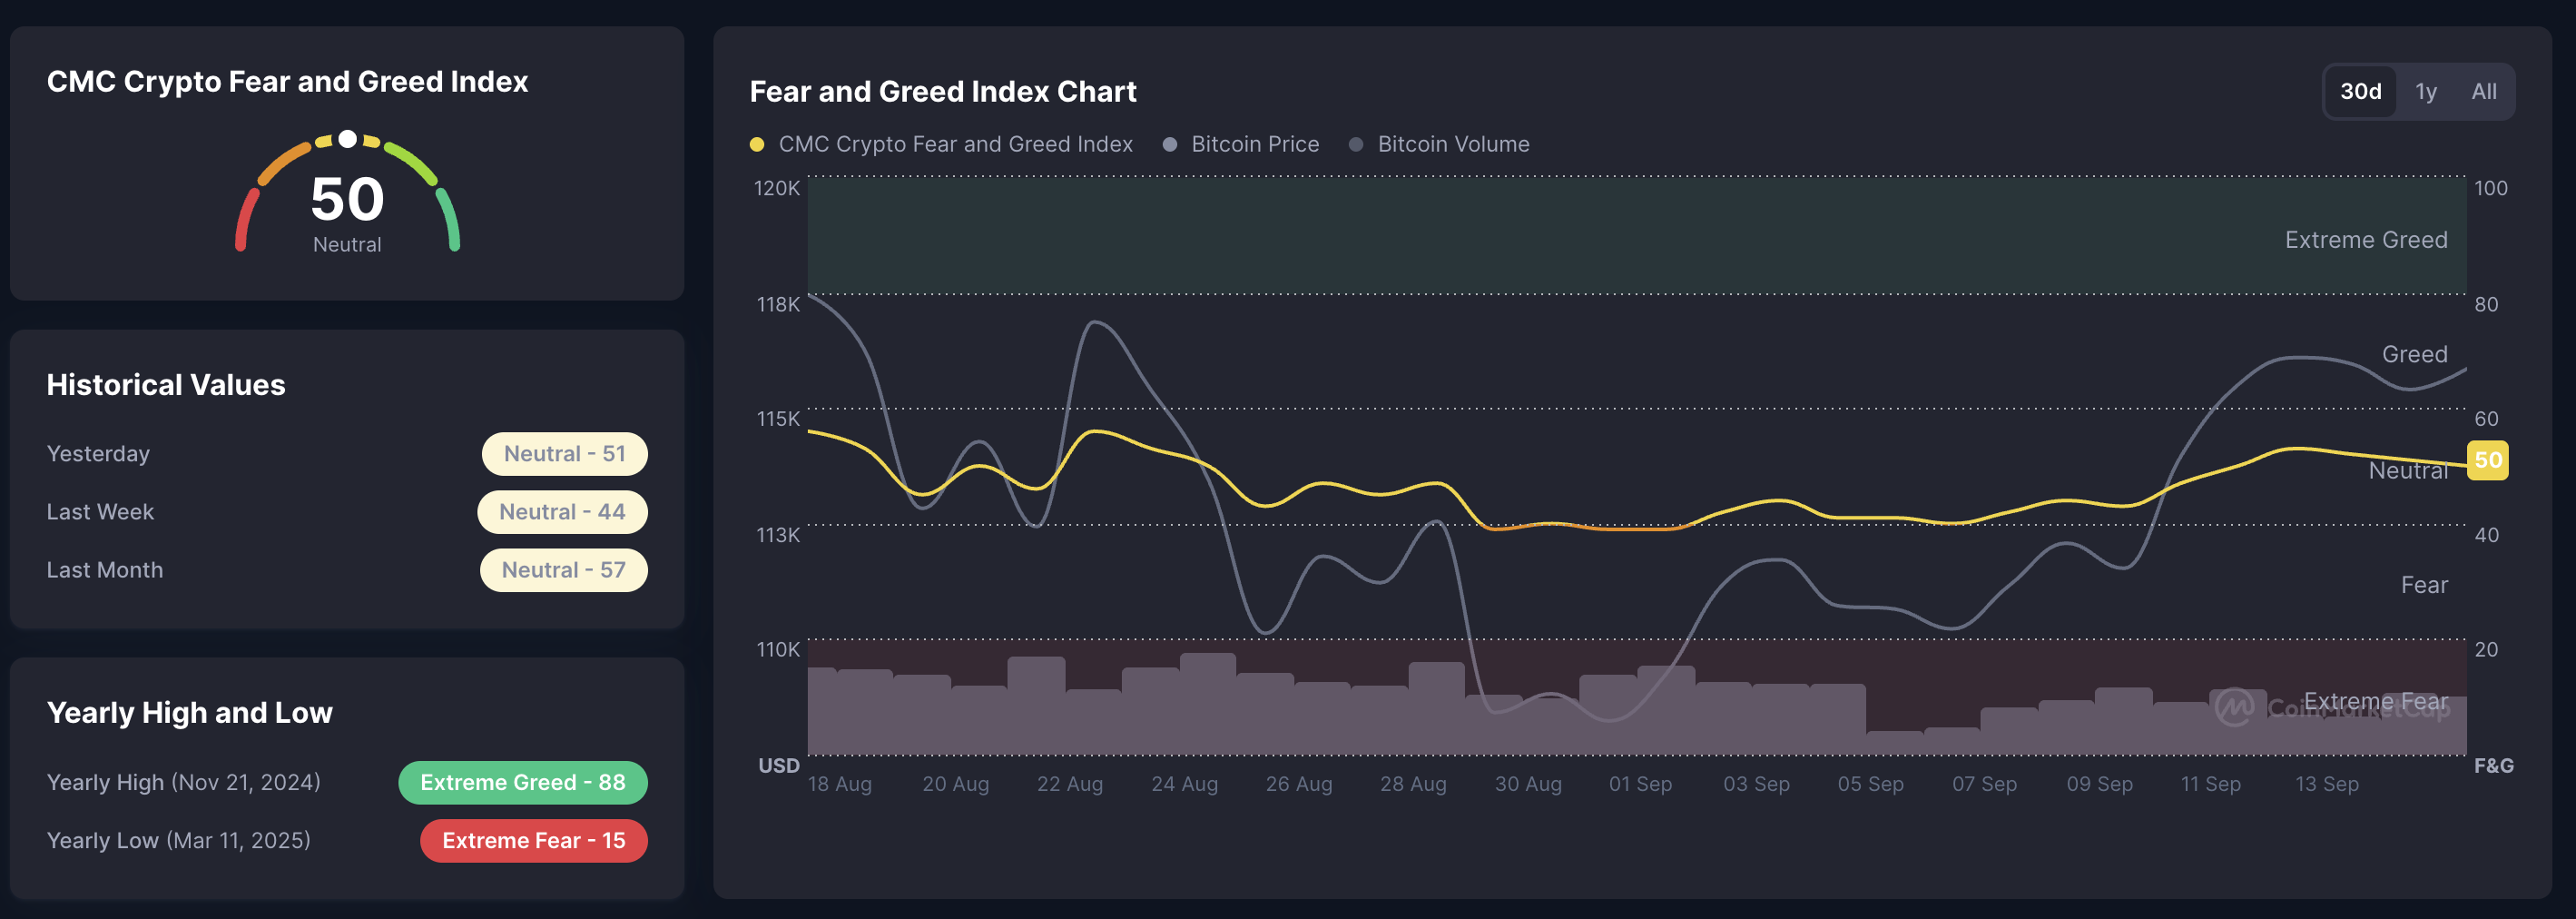
Crypto Fear and Greed Index. Source: CoinMarketCap
Pi Network’s crucial resistance emerges at the 50-day EMA
Pi Network edges lower by almost 1% at the time of writing on Tuesday, retracing from the intraday high of $0.3643. This results in a retest of a broken falling channel’s resistance trendline on the daily chart, acting as the crossroads for the mobile mining cryptocurrency.
If PI bounces back from $0.35, it should surpass the 50-day Exponential Moving Average (EMA) at $0.3805 to enforce an uptrend. This dynamic resistance has remained intact since May 21, providing four bearish reversal points. A decisive close above the 50-day EMA could target the R1 pivot level at $0.4437.
Adding to the upside potential, the technical indicators suggest that the bulls hold trend control on the daily chart. The Relative Strength Index (RSI) at 48 moves sideways, close to the halfway mark, flashing a neutral signal.
However, the Moving Average Convergence Divergence (MACD) and its signal line hold a steady upward trend amid successive green histogram bars, indicating steady bullish momentum.
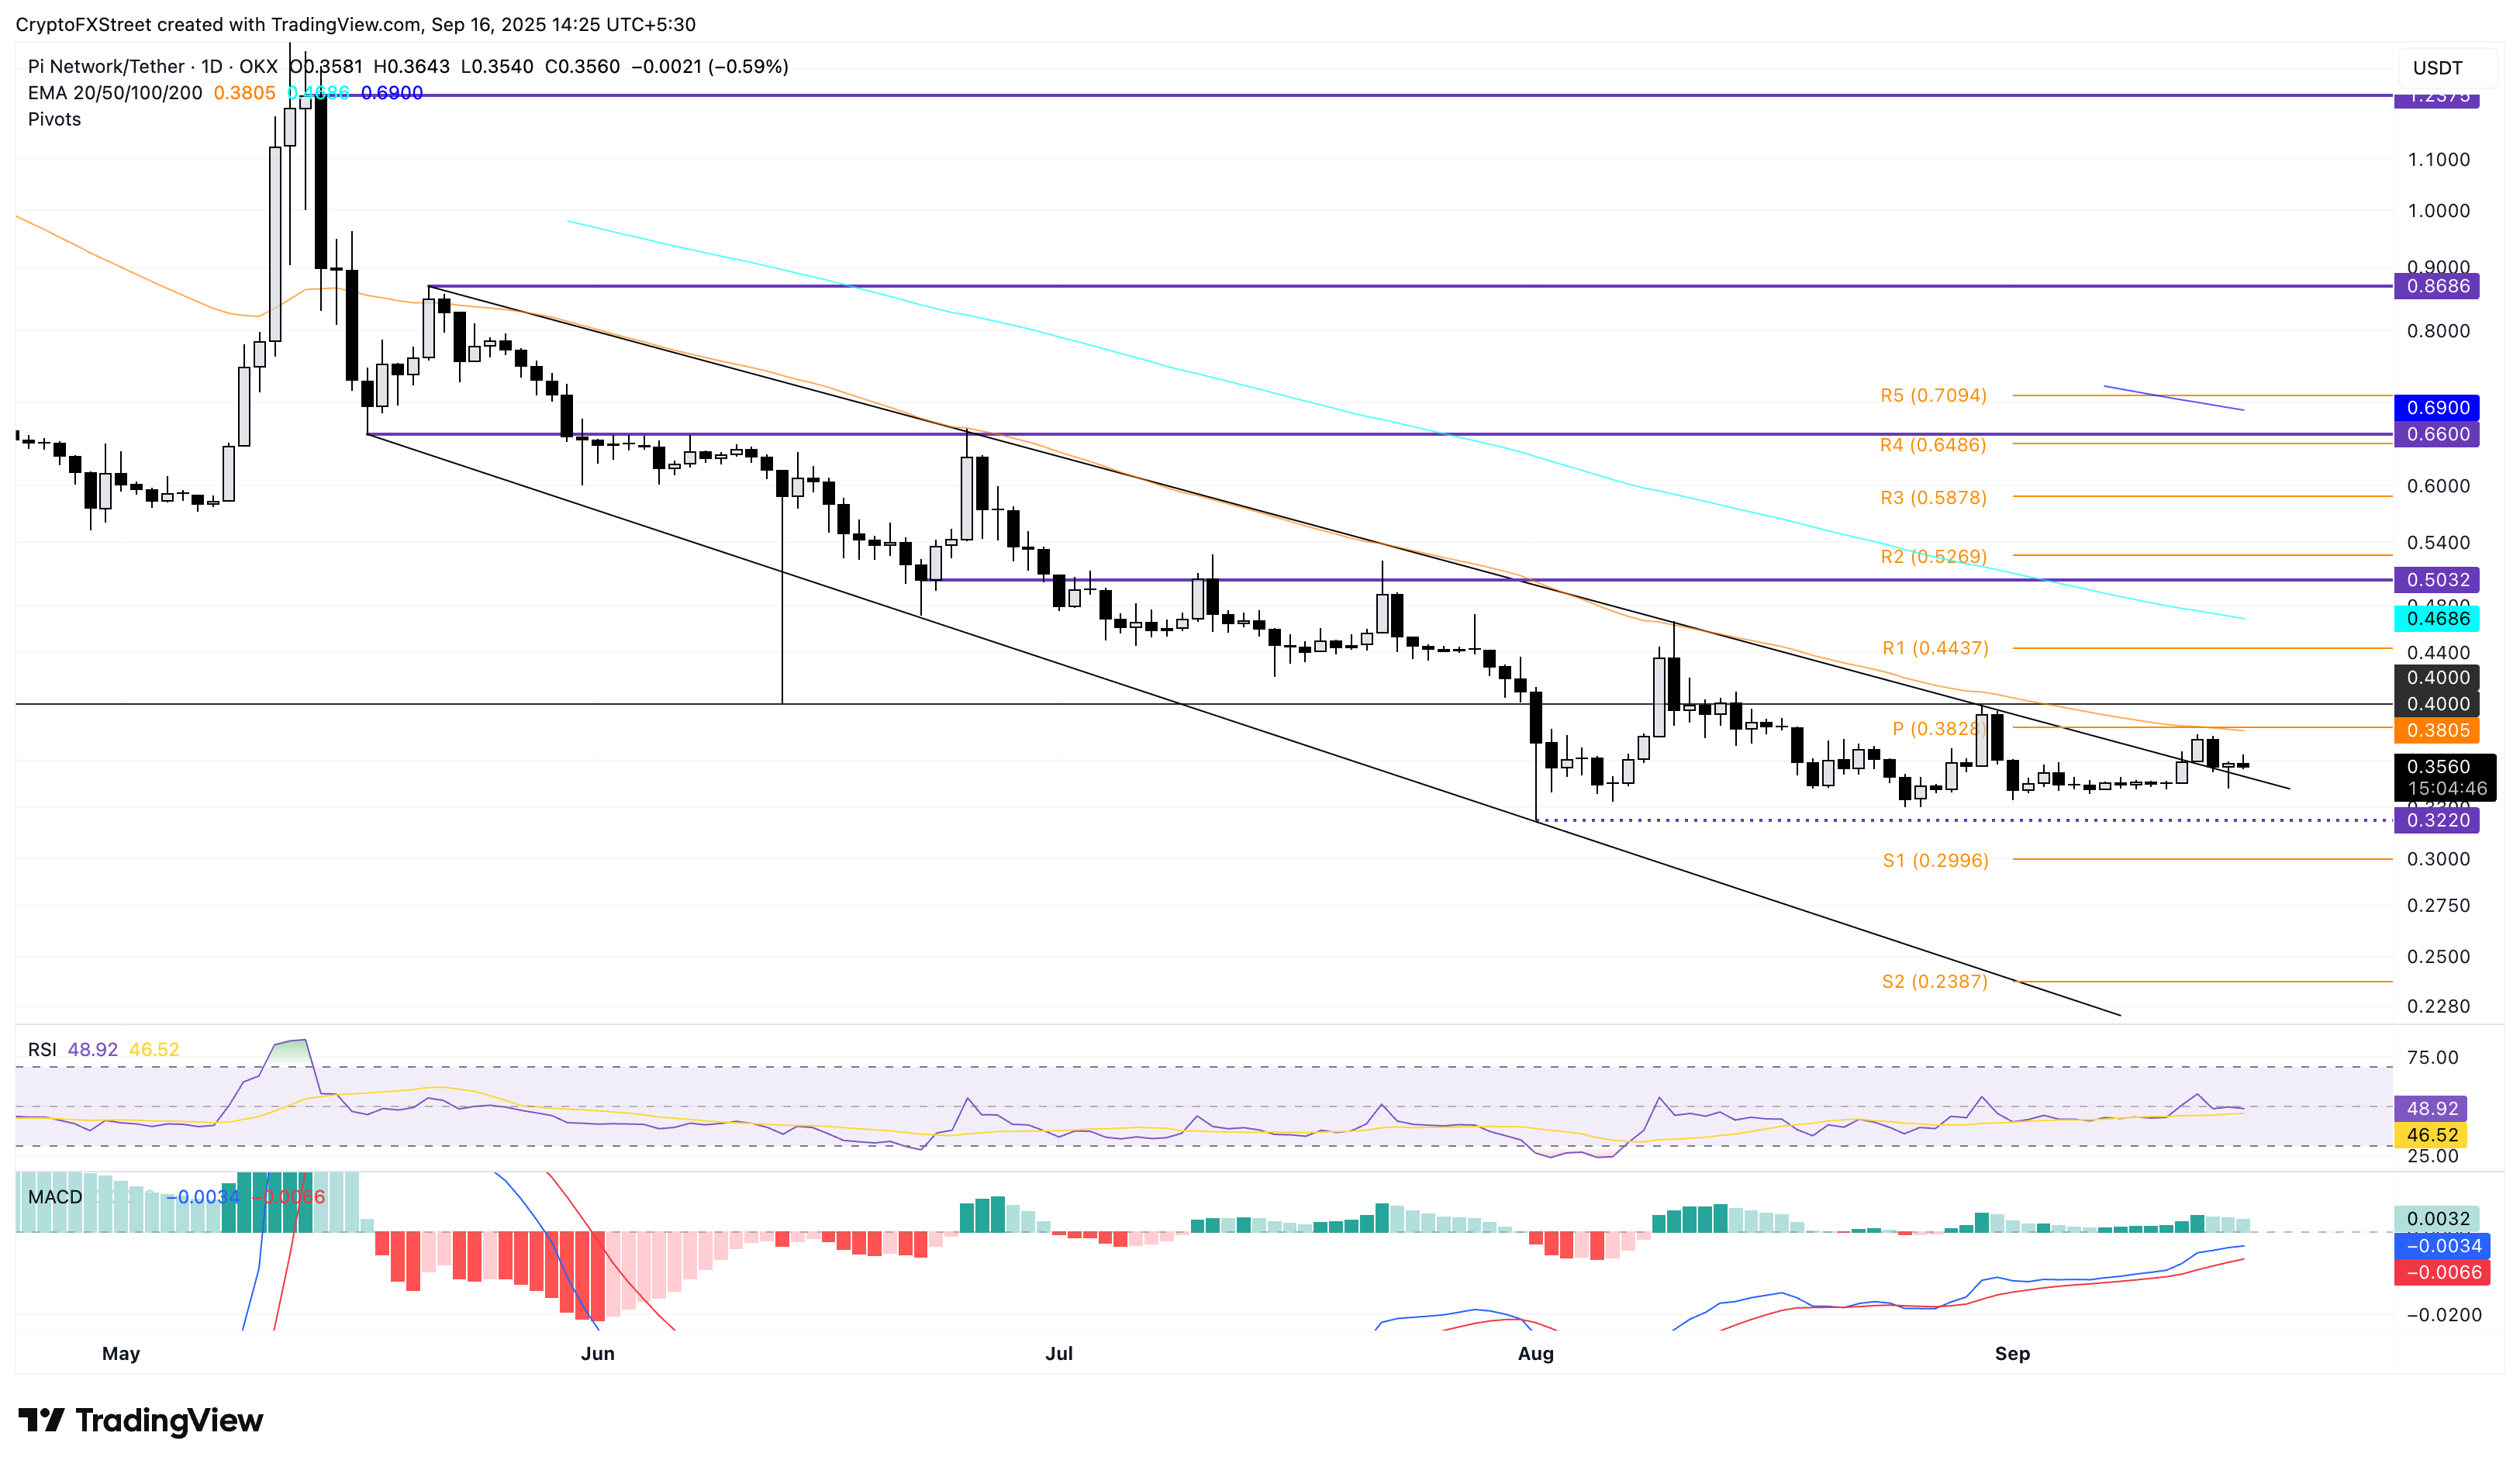
PI/USDT daily price chart.
On the contrary, if PI fails to hold the broken trendline at $0.3500 round figure, it could result in a new bearish pressure to the record low of 0.3220 set on August 1. Further down, the pivot levels highlight the next supports at the S1 and S2 levels at $0.2996 and $0.2387, respectively.
Cryptocurrency prices FAQs
Token launches influence demand and adoption among market participants. Listings on crypto exchanges deepen the liquidity for an asset and add new participants to an asset’s network. This is typically bullish for a digital asset.
A hack is an event in which an attacker captures a large volume of the asset from a DeFi bridge or hot wallet of an exchange or any other crypto platform via exploits, bugs or other methods. The exploiter then transfers these tokens out of the exchange platforms to ultimately sell or swap the assets for other cryptocurrencies or stablecoins. Such events often involve an en masse panic triggering a sell-off in the affected assets.
Macroeconomic events like the US Federal Reserve’s decision on interest rates influence crypto assets mainly through the direct impact they have on the US Dollar. An increase in interest rate typically negatively influences Bitcoin and altcoin prices, and vice versa. If the US Dollar index declines, risk assets and associated leverage for trading gets cheaper, in turn driving crypto prices higher.
Halvings are typically considered bullish events as they slash the block reward in half for miners, constricting the supply of the asset. At consistent demand if the supply reduces, the asset’s price climbs.
Author

Vishal Dixit
FXStreet
Vishal Dixit holds a B.Sc. in Chemistry from Wilson College but found his true calling in the world of crypto.


