Dog-theme memecoins DOGE and SHIB crashes, over $90 million wiped out
- Dogecoin and Shiba Inu prices continue to edge down on Monday after falling more than 10% on the previous day.
- These dog theme-based memecoins liquidated over $90 million leveraged traders in 24 hours.
- The technical outlook suggests a continuation of the downleg, as both memecoins’ momentum indicators favor downward move.
Dogecoin (DOGE) and Shiba Inu (SHIB) prices continue to edge down on Monday after falling more than 10% the previous day. The recent downturn has liquidated over $90 million from these dog theme-based memecoins in the last 24 hours. The technical outlook suggests the continuation of the downturn, as both memecoins momentum indicators show a bearish trend.
Dog memecoins traders face massive wipeout
The dog theme-based memecoins DOGE and SHIB declined more than 17% in the last two days. The coins continue their double-digit declines on Monday, triggering a wave of liquidations, resulting in over $90 million in total liquidations and more than $80.91 million specifically in DOGE, according to data from CoinGlass.
Huge Liquidations like this could spark Fear, Uncertainty and Doubt (FUD) among the dog theme-based memecoins investors and could cause a rise in selling pressure, leading to further decline in its prices.
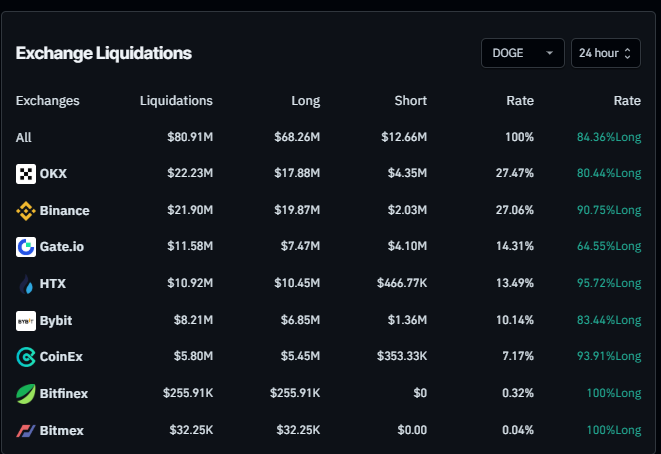
DOGE Liquidation chart. Source: Coinglass
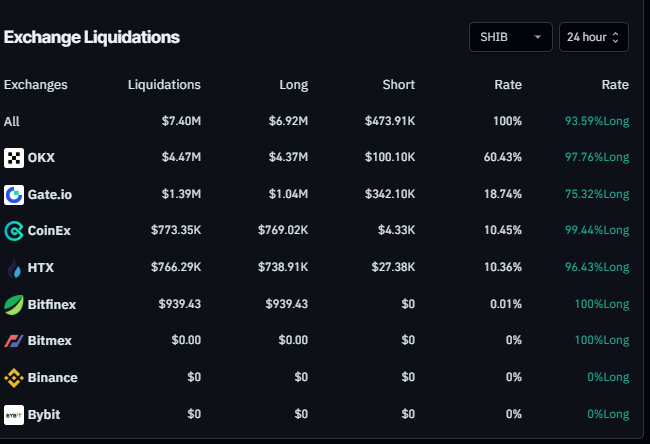
SHIB Liquidation chart. Source: Coinglass
Dogecoin Price Forecast: Bears take the lead
Dogecoin price faced rejection around its 61.8% Fibonacci retracement level on January 21 (drawn from the December 8 high of $0.48 to the December 20 low of $0.26) at $0.40 and declined 27.80% in the next 10 days, closing below its 200-day EMA at $0.31 on Saturday. At the time of writing on Monday, it continues to trade down by 13.4%, around $0.23.
If DOGE continues to crash, it could extend its decline to test its weekly support at $0.18.
The Relative Strength Index (RSI) on the daily chart reads 25, below its oversold levels of 30, indicating a strong bearish momentum. Moreover, the Moving Average Convergence Divergence (MACD) also continues to show a bearish crossover, suggesting the continuation of a bearish trend.
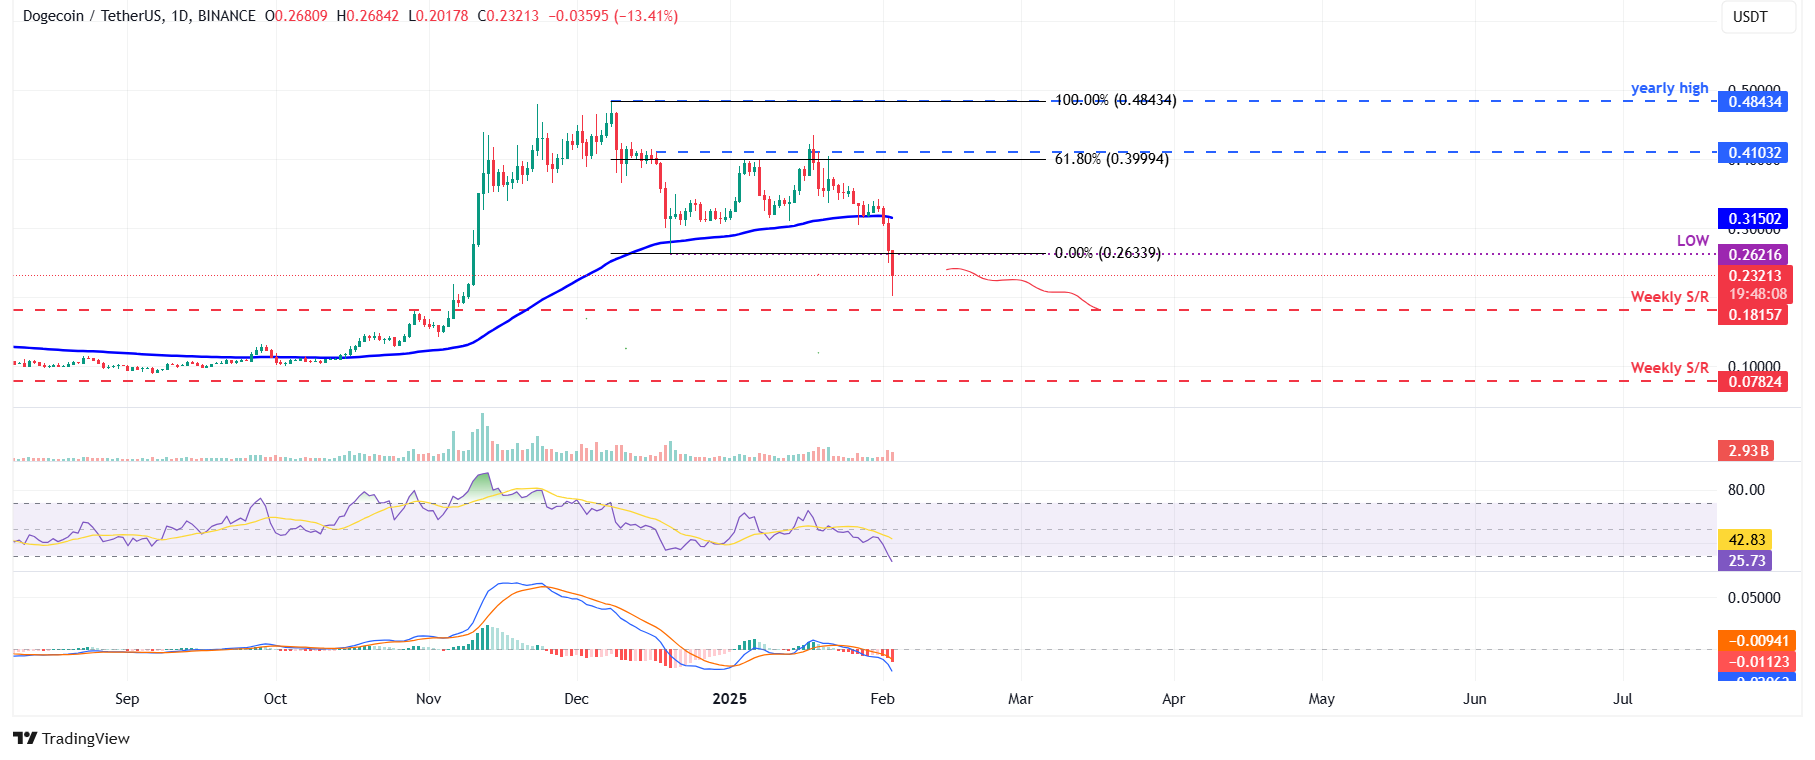
DOGE/USDT daily chart
Shiba Inu Price Forecast: Bears aim for $0.000010 mark
Shiba Inu price broke and closed below its ascending trend (drawn from connecting multiple lows since August 5) on January 24 and declined 22.22% in the next 8 days, closing below the November 3 low of $0.000016 on Sunday. At the time of writing on Monday, it continues to trade down by 11.61%, around $0.000013.
If SHIB continues its correction, it could extend its decline to test the August 5 low of $0.000010.
The RSI on the daily chart reads 23, below its oversold levels of 30, indicating a strong bearish momentum. The MACD also continues to show a bearish crossover, suggesting the continuation of a bearish trend.
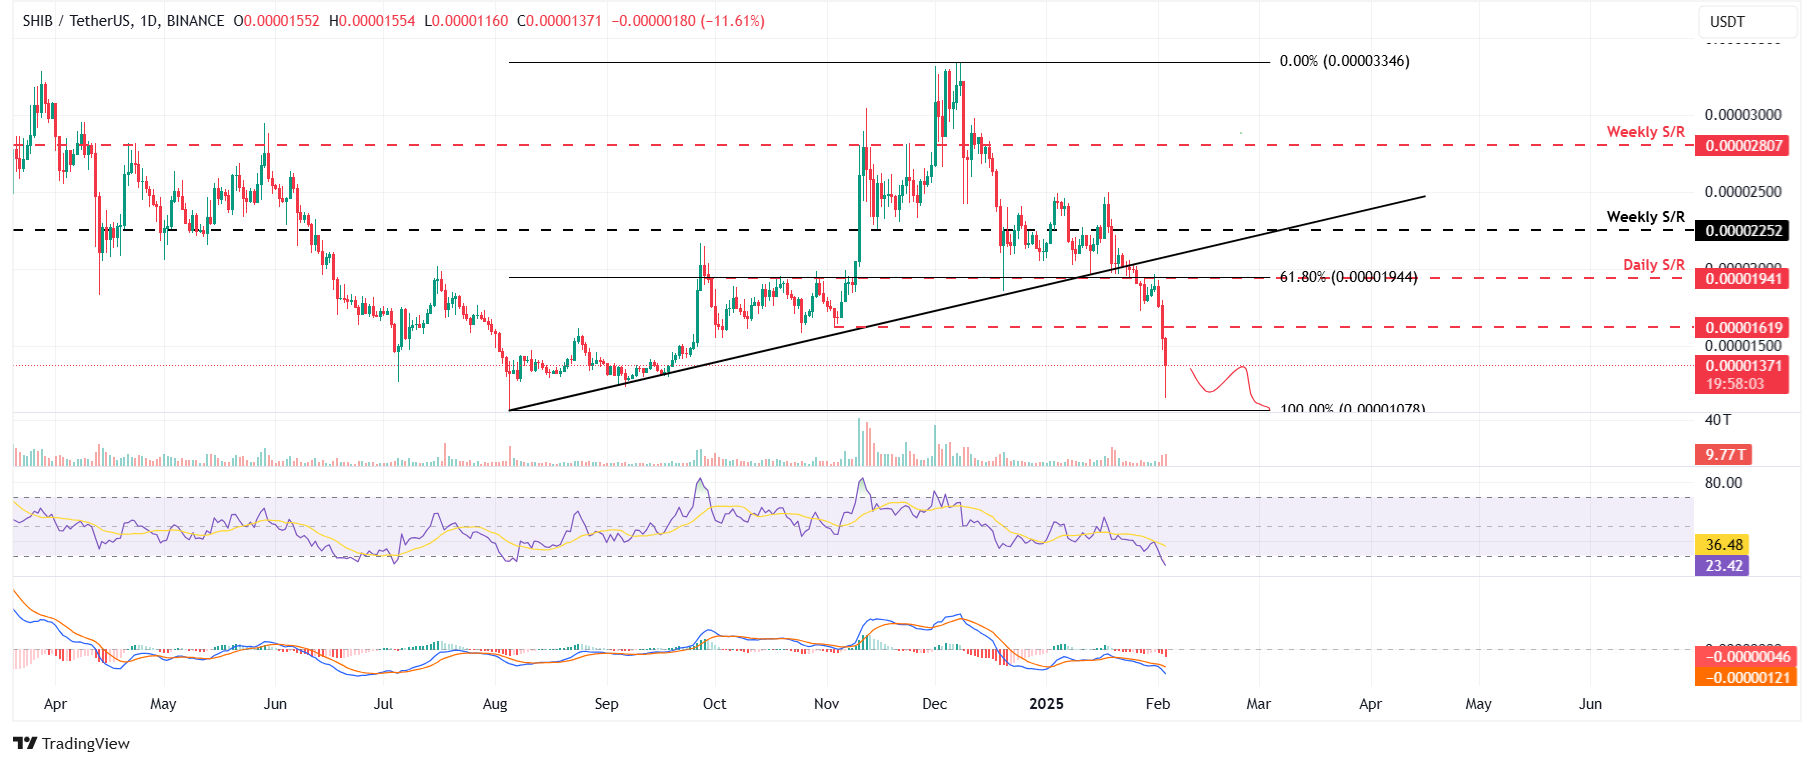
SHIB/USDT daily chart
Author

Manish Chhetri
FXStreet
Manish Chhetri is a crypto specialist with over four years of experience in the cryptocurrency industry.




