Pepe Price Forecast: PEPE eyes a range breakout amid improving sentiment after President Trump’s post
- Pepe leads the meme coin segment with gains as DOGE and SHIB struggle to bounce back.
- With President Trump’s recent post featuring Pepe in the background, the meme coin heats up.
- PEPE’s technical outlook signals a potential range breakout rally as derivative metrics show rising interest in the token.

Pepe (PEPE) is up over 6% at press time on Thursday after US President Donald Trump shared a post on Truth Social with the frog mascot in the background, igniting new hype and hinting at a potential breakout from a consolidation range for bullish follow-through.
Trump’s post boosts Pepe
US President Trump shared a post on his social media platform, Truth Social, portraying himself as being on a mission. The image read “HE’S ON A MISSION FROM GOD & NOTHING CAN STOP WHAT IS COMING.”
At first glance, the caption seems to be intended for the President. However, PEPE’s frog-themed mascot can be found lurking in the background. This has heightened bullish sentiment around the meme coin.
Pepe’s official X post shared a zoomed-in image of the frog and highlighted “Nothing Can Stop What Is Coming.”

PEPE to outgrow the sideways range
Pepe trades at $0.0000144 with an over 3% intraday surge nearing the long-standing $0.0000150 resistance level since May 12, except for a minor deviation on May 23. Alongside the upper resistance, PEPE forms a consolidation range with the lower boundary at $0.0000119 since May 9.
The Relative Strength Index (RSI) at 57 shows a positive spike crossing above the halfway line, suggesting a boost in bullish momentum.
The Supertrend indicator showcases a bearish trend in motion as PEPE trades below the red line near $0.0000150. As the Supertrend line is near the range’s upper ceiling, a potential breakout could lead to a high momentum rally.
According to the trend-based Fibonacci tool, with the first leg at the opening price of May 26 at $0.0000076 and the consecutive legs coinciding with the range boundary lines, the immediate resistance lies at $0.00000168, aligning with the 50% Fibonacci retracement.
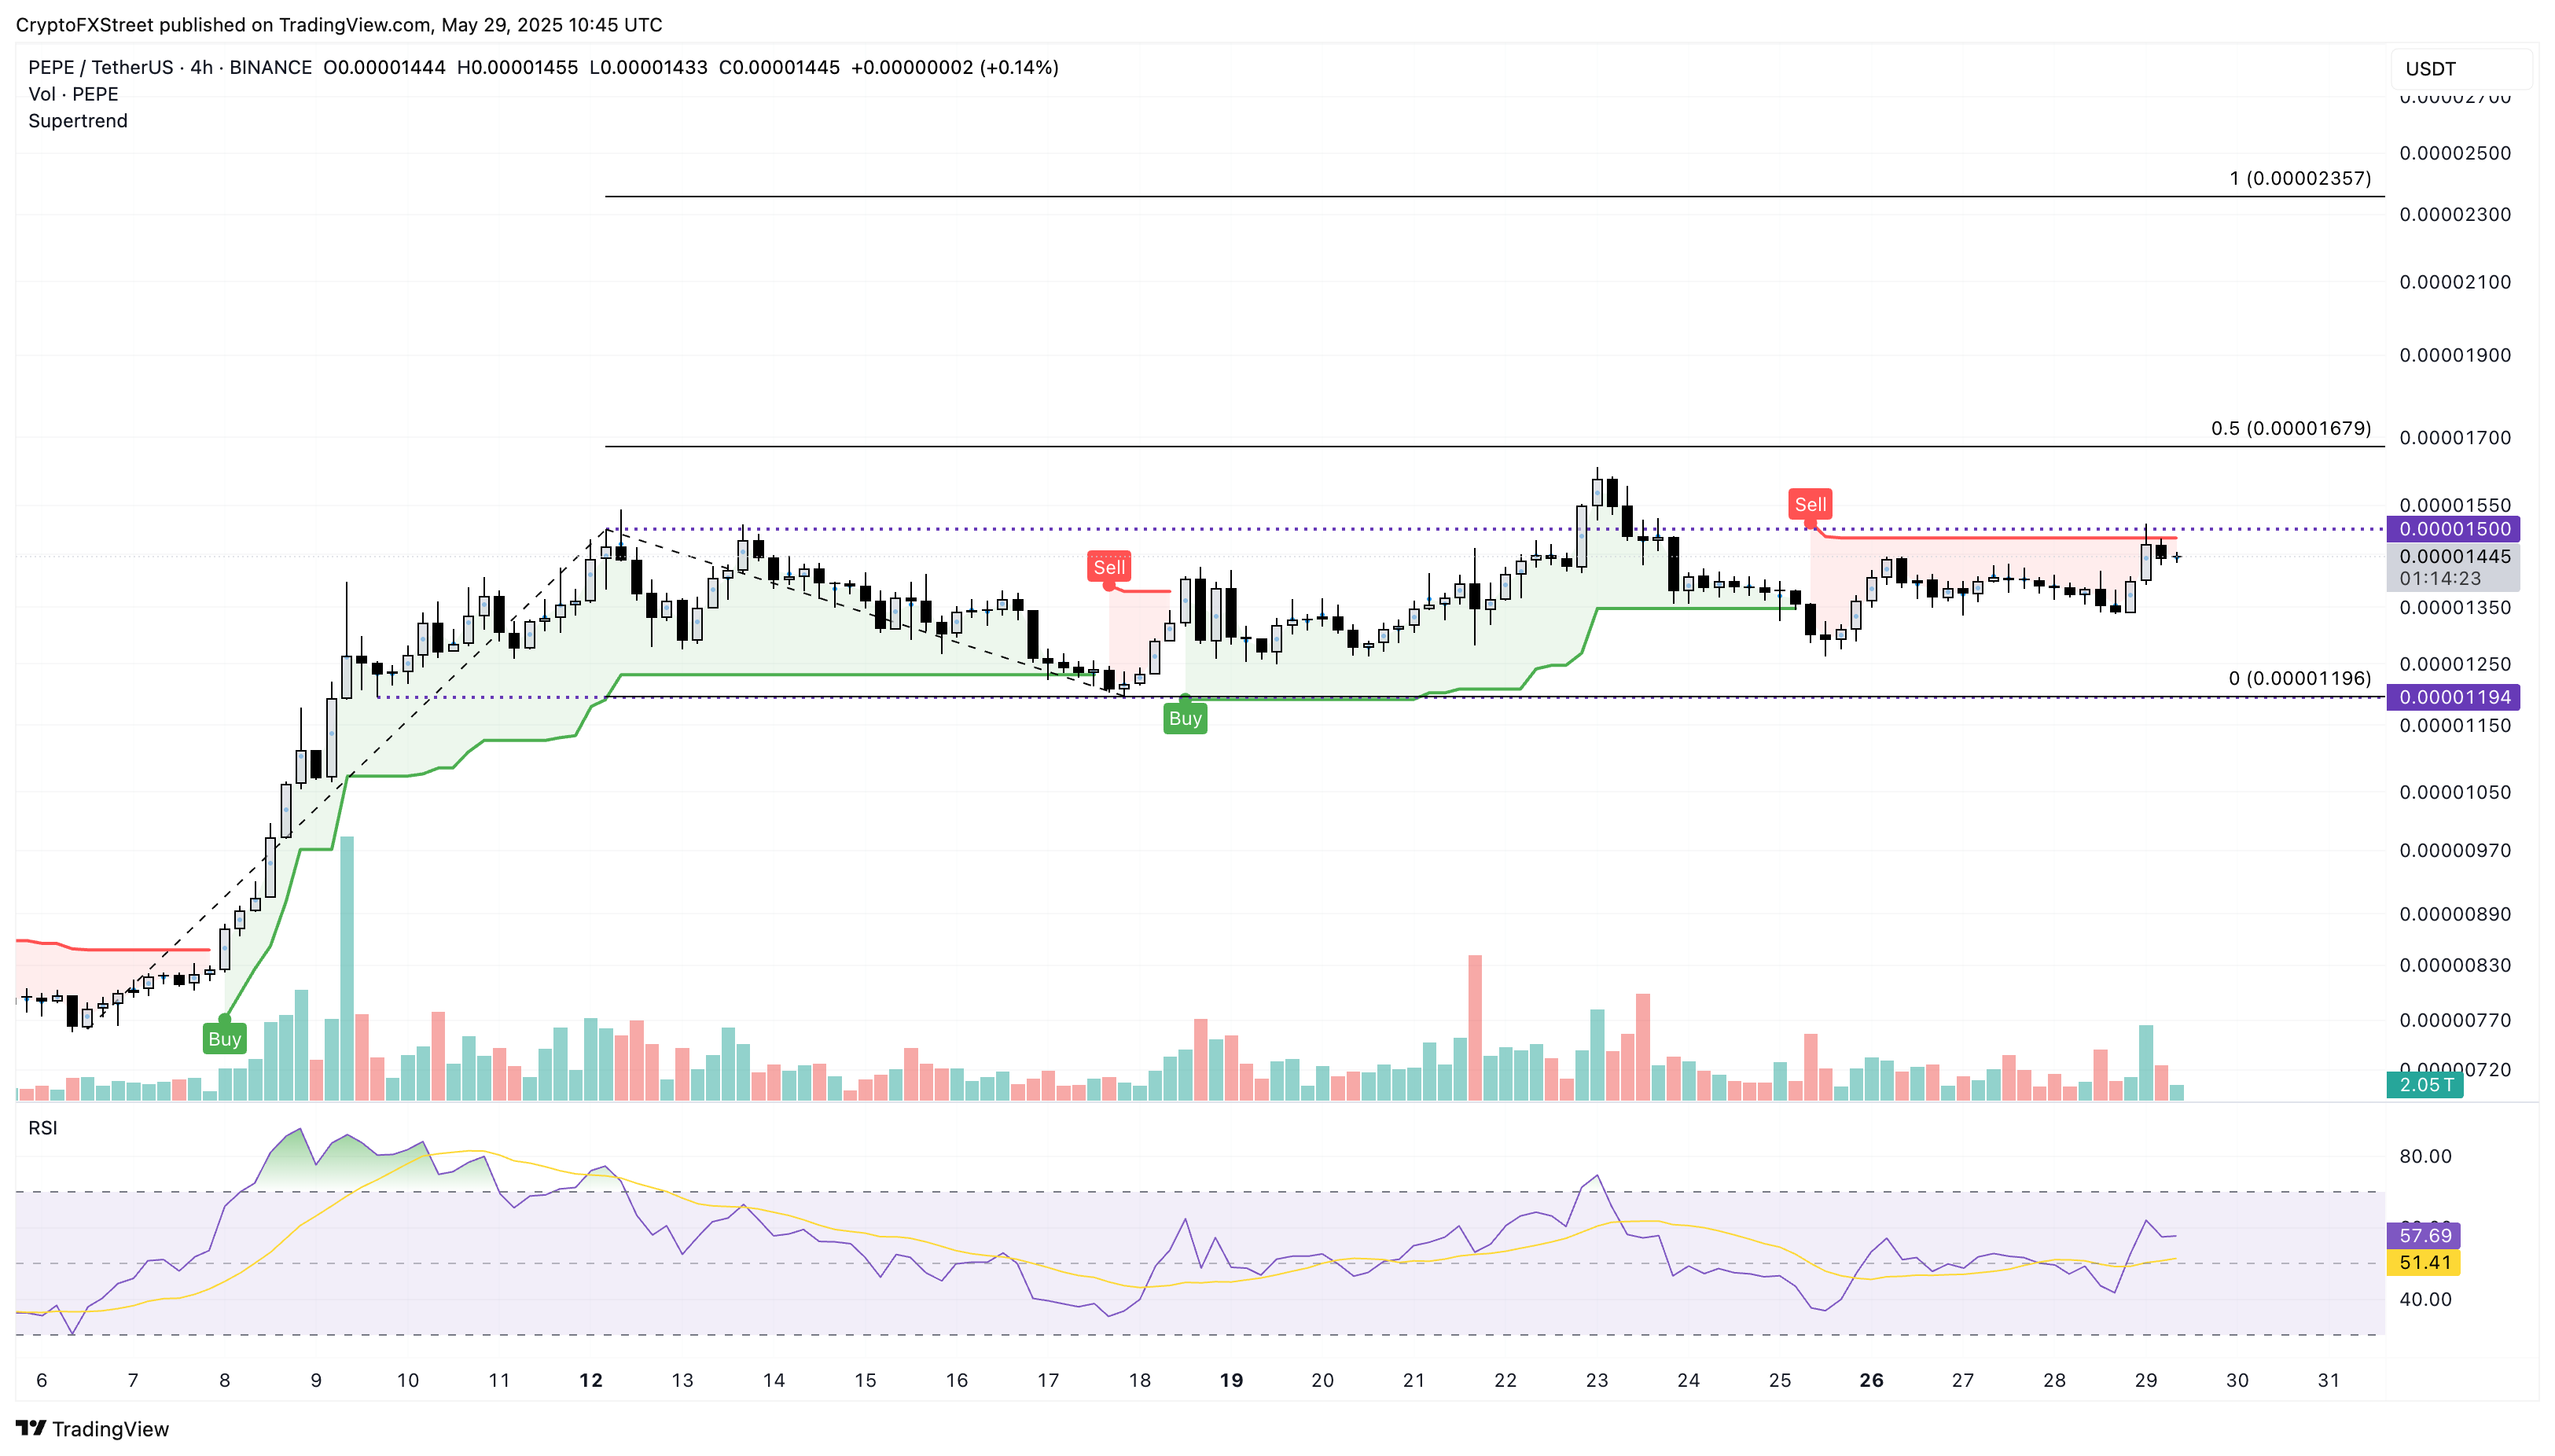
PEPE/USDT 4-hour price chart. Source: Tradingview
On the flip side, a reversal from $0.0000150 could result in PEPE’s decline to the $0.0000119 support level.
Bullish bias grows in Pepe’s derivatives
With a surge in bullish sentiment, Coinglass data reflects an increase in traders' interest, with an 11% rise in Pepe’s Open Interest (OI) to $668.48 million at press time on Thursday.

PEPE Futures Open Interest. Source: Coinglass
The Long/Short Ratio chart helps clarify the rising bullish incline with the rising taker buy volume. Over the last 48 hours, the taker buy volume has surged to 50.79% from 48.41%, pumping the long/short ratio to 1.032 from 0.9384, suggesting a bullish bias.
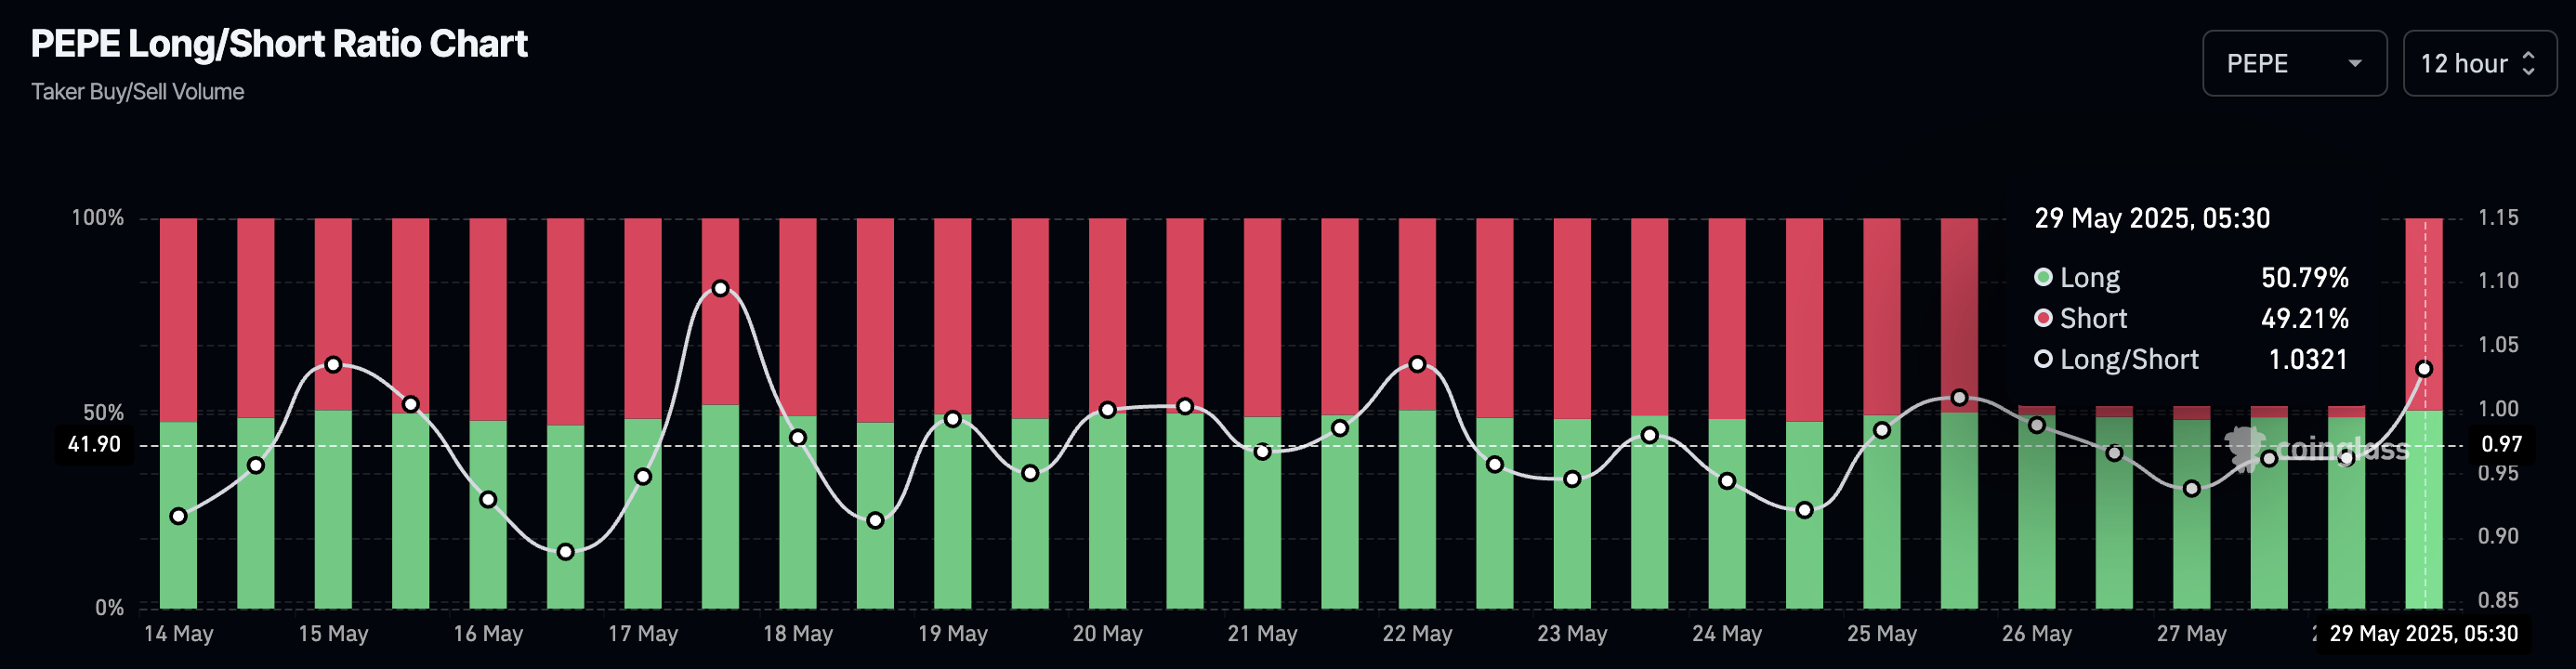
PEPE Long/Short Ratio Chart. Source: Coinglass
Author

Vishal Dixit
FXStreet
Vishal Dixit holds a B.Sc. in Chemistry from Wilson College but found his true calling in the world of crypto.



