Pepe Price Forecast: PEPE price action shows a bearish divergence in play
- Pepe price hovers $0.000013 on Tuesday after rejecting the key resistance level last week.
- PEPE’s momentum indicators show a bearish divergence, suggesting a possible trend reversal.
- On-chain data show bearish bets among traders reached its highest in over a month.

Pepe (PEPE) price shows signs of bullish exhaustion on Tuesday after failing to breach a key resistance level at $0.000016 last week. The price action of the frog-themed meme coin flashes a bearish divergence on the momentum indicators, suggesting a possible trend reversal. Meanwhile, on-chain data shows an uptick in bearish sentiment, with short positions among traders climbing to the highest level in over a month, raising the odds of a potential downside move.
Pepe Price Forecast: Momentum indicators show weakness
Pepe price faced rejection around its daily level at $0.000016 on Friday and declined 12.19% until Sunday. However, it recovered slightly at the start of the week. At the time of writing on Tuesday, it hovers at $0.000013.
The Relative Strength Index (RSI) indicator reflects weakness in momentum on the daily chart. The higher high in the frog-theme meme coin formed on Friday does not reflect the RSI lower high for the same period. This development is termed a bearish divergence, often leading to a trend reversal or short-term pullback. Moreover, the Moving Average Convergence Divergence (MACD) indicator also showed a bearish crossover on Saturday, suggesting a sell signal and a correction ahead.
Coinglass’s long-to-short ratio also shows another bearish sign for PEPE, which reads 0.86. This ratio below one reflects bearish sentiment in the markets as more traders are betting for the memecoin to fall.
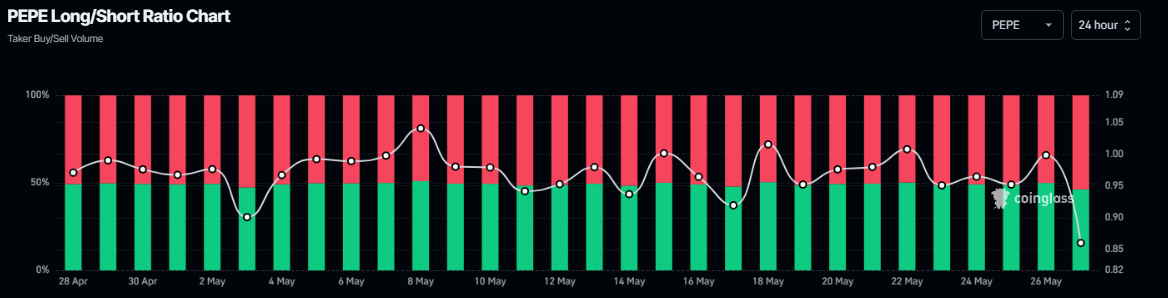
PEPE long-to-short ratio chart. Source: Coinglass
Sideline investors looking for sell opportunities could do so at its current level at $0.000013.
If Pepe’s pullback continues, it could extend the decline to retest its next daily support at $0.000012. Any follow-through selling below this level could set off a drop to $0.000011, its 50-day Exponential Moving Average (EMA).
The bearish outlook of the Pepe meme coin remains in place as the price is below the key daily resistance level at $0.000016 on the daily chart; a close above this level would invalidate the bearish thesis.
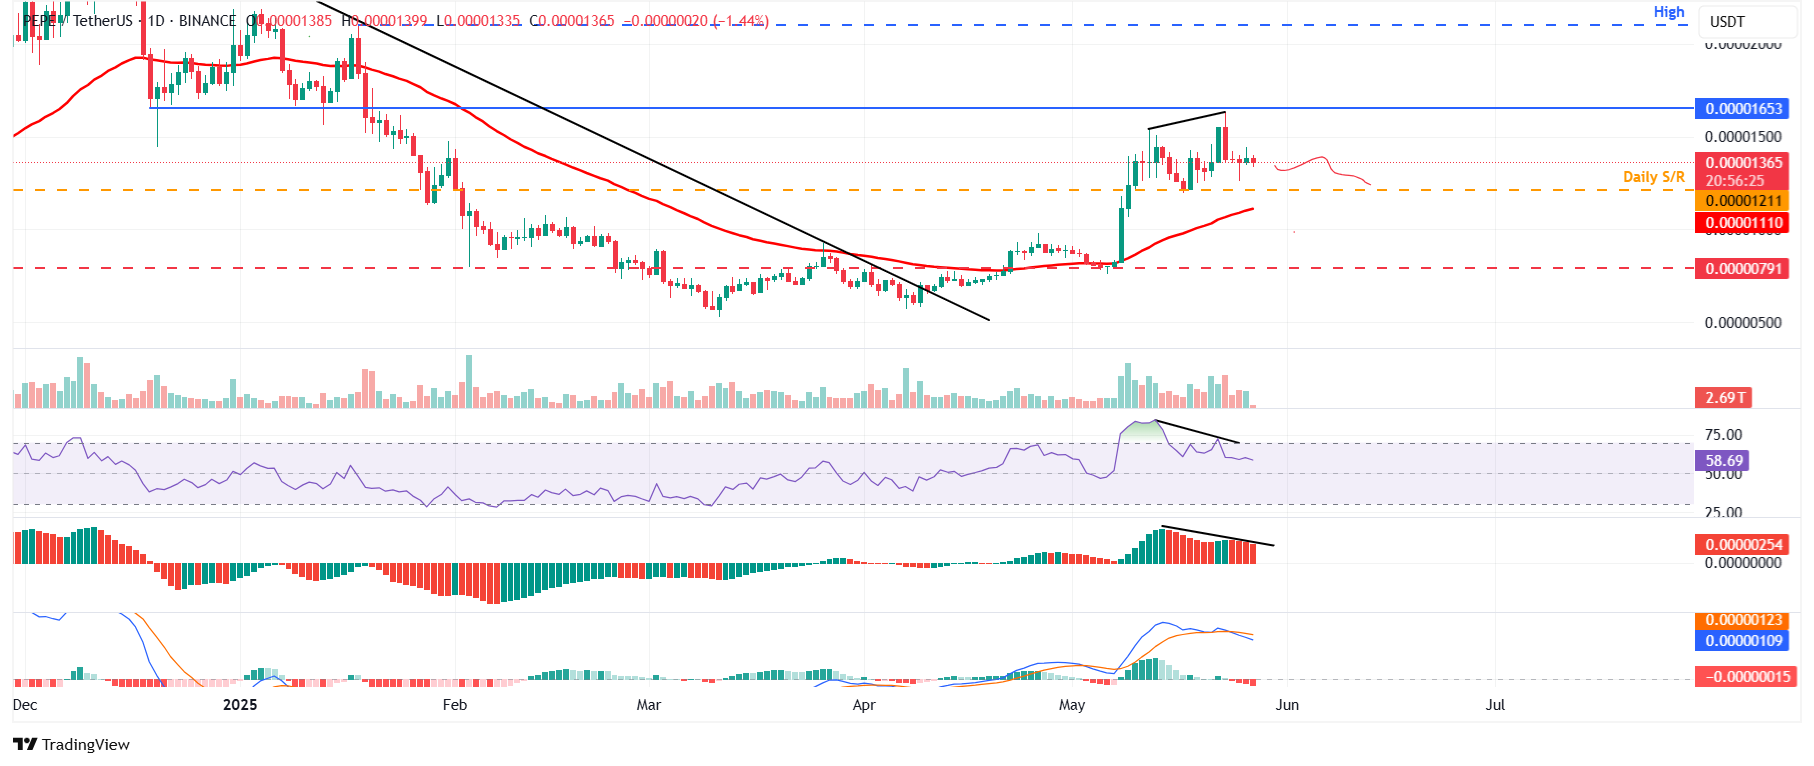
PEPE/USDT daily chart
Author

Manish Chhetri
FXStreet
Manish Chhetri is a crypto specialist with over four years of experience in the cryptocurrency industry.


