Pepe poised for 18% crash following breakdown from ascending trendline
- Pepe price is retesting its ascending trendline support on Tuesday and a daily close below it would confirm a downtrend ahead.
- On-chain data suggests that PEPE’s active addresses are decreasing, signaling lower demand for the network.
- A daily candlestick close above $0.0000124 would invalidate the bearish thesis.

Pepe (PEPE) price continues to test its ascending trendline support on Tuesday, with on-chain data indicating lower demand for the network, signaling a potential upcoming downturn in Pepe's price.
Pepe sets for a break below ascending trendline
Pepe price is currently testing its ascending trendline support. The trendline is drawn from joining multiple swing low levels between mid-April and mid-June, as shown in the one-day chart below.
If Pepe's price breaks below the trendline, it could crash 18% from the point of the breakout to $0.0000903. This is the 61.8% Fibonacci retracement level drawn from a swing low of $0.0000393 on April 13 to a swing high of $0.0000172 on May 27.
The Relative Strength Index (RSI) and the Awesome Oscillator (AO) on the daily chart support this bearish scenario, as both indicators are below their respective mean levels of 50 and zero. This suggests the continued momentum favoring bears, potentially leading to a further decline in PEPE's price.
If the bears are aggressive and the overall crypto market outlook is negative, PEPE could even break below $0.0000903 and extend the decline by an additional 34% to retest its low of $0.0000592 from May 1.
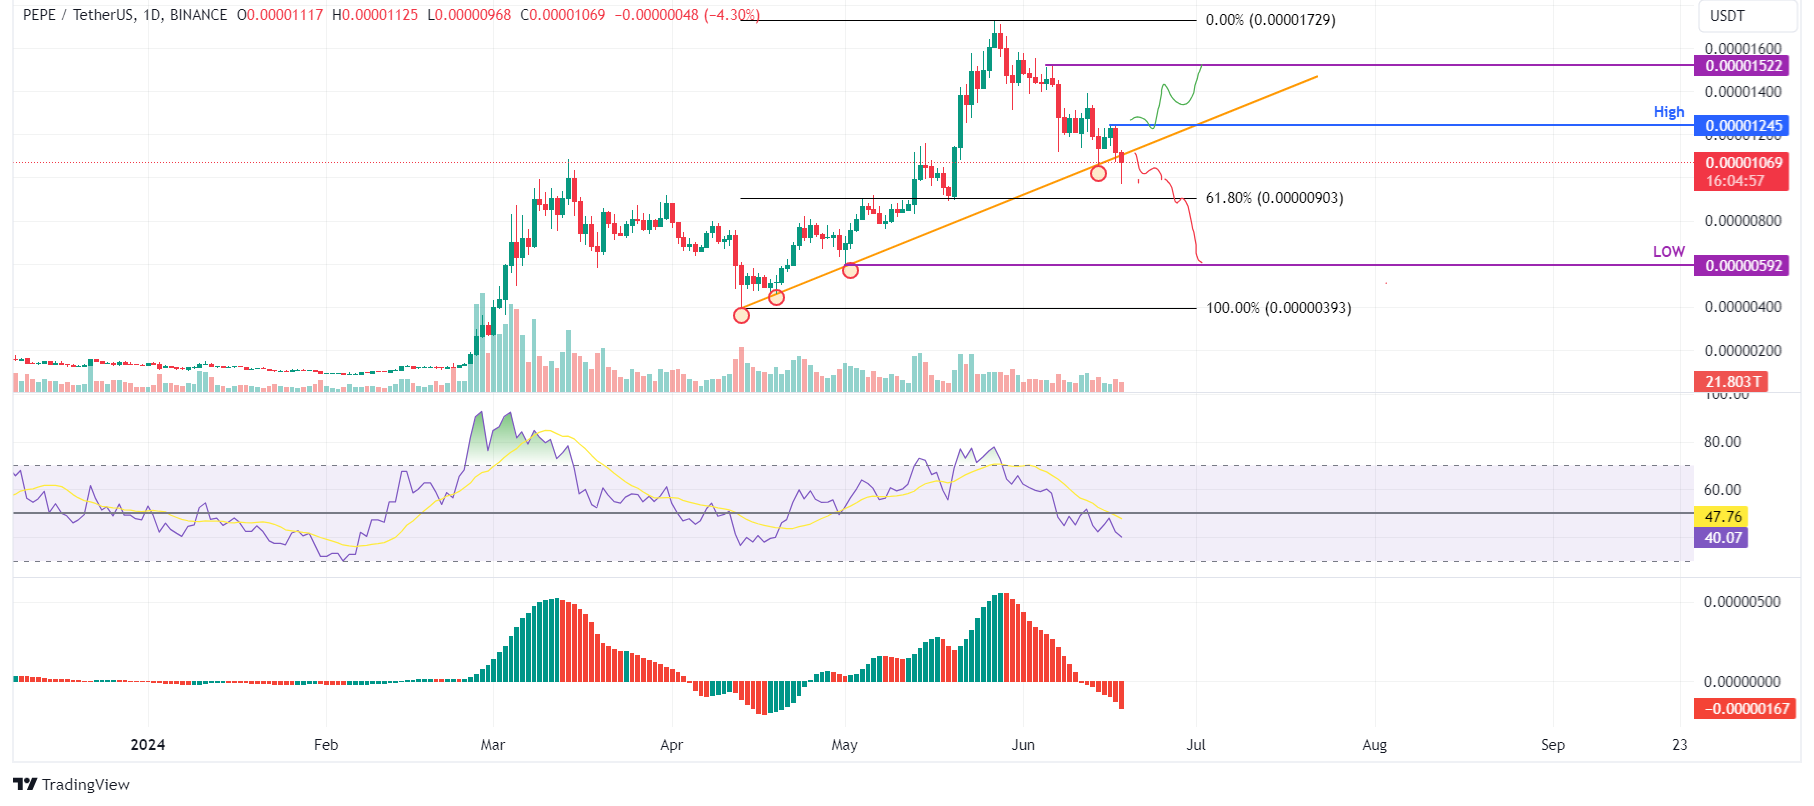
PEPE/USDT daily chart
On-chain data also points to a bearish outlook for PEPE price. According to IntoTheBlock's In/Out of the Money Map (IOMAP), approximately 1,400 addresses bought 17.94 trillion PEPE tokens at an average price of $0.000011. If the price rises at this level, this significant amount of investors may opt to sell to get a breakeven on their positions.
From a technical analysis perspective, the $0.000011 resistance level aligns with the IOMAP findings, marking this zone as a crucial reversal point to monitor.
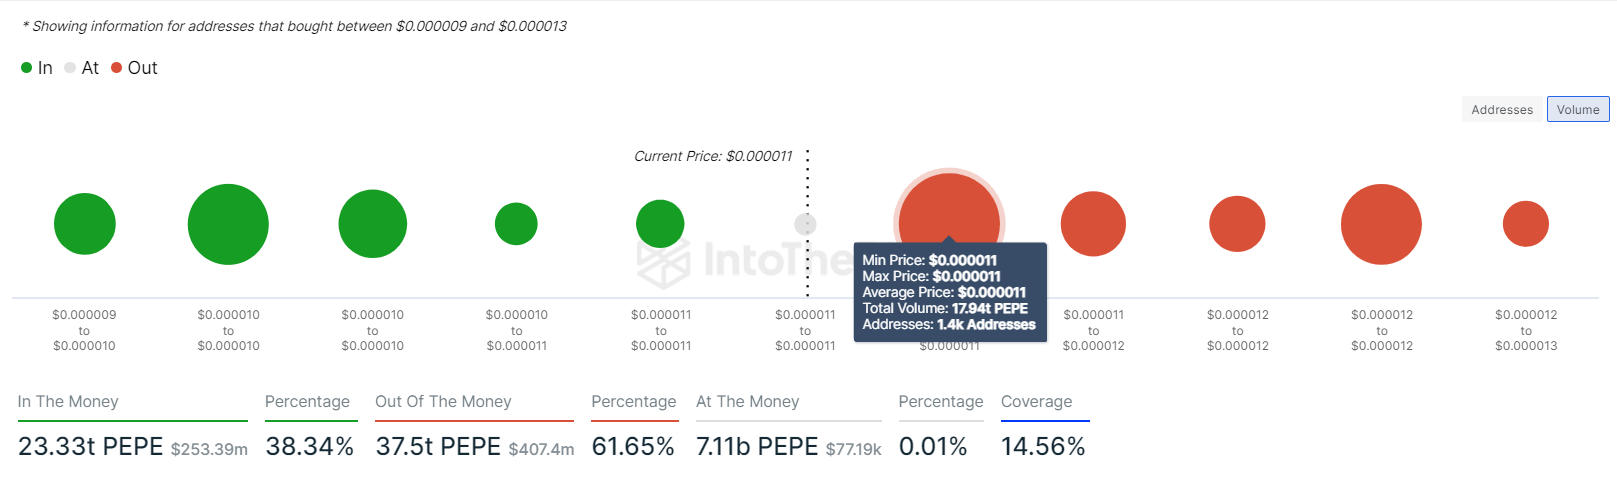
PEPE IOMAP chart
Santiment’s Daily Active Addresses index, which helps track network activity over time, aligns with the bearish outlook noted from a technical perspective. The rise in the metric signals greater blockchain usage, while declining addresses point to lower demand for the network.
In PEPE’s case, Daily Active Addresses have fallen by 25% in the last ten days, extending a downtrend that originated at the end of May This decline indicates that demand for PEPE’s network is waning, which could lead to a crash in Pepe's price.
%20[13.27.08,%2018%20Jun,%202024]-638543043519378569.png)
PEPE Daily Active Addresses chart
Even though on-chain metrics and technical analysis point to a bearish outlook, if Pepe’s price produces a daily candlestick close above $0.0000125, the daily high from June 16, the move would invalidate the bearish thesis by making a higher high on the daily time frame. This development could see PEPE's price rally 22% to the next resistance level at the June 6 high of $0.0000152.
Author

Manish Chhetri
FXStreet
Manish Chhetri is a crypto specialist with over four years of experience in the cryptocurrency industry.


