Patterns: ETH/USD, BTC/USD

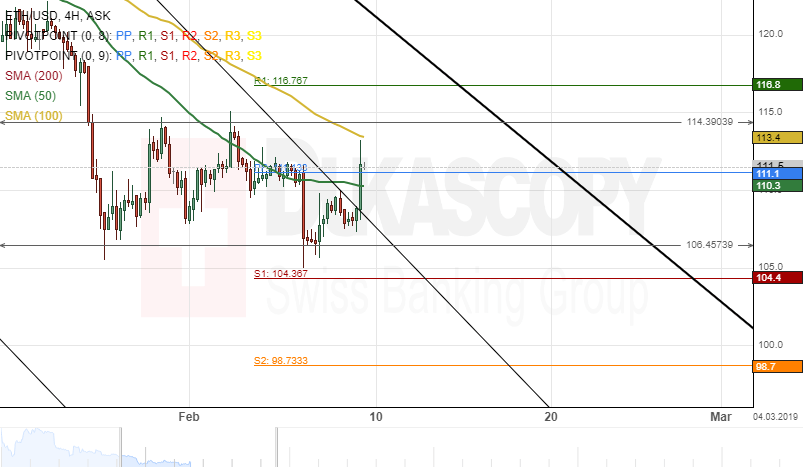
ETH/USD 4H Chart: Pressure by 50-hour SMA
The Ethereum cryptocurrency has been trading between the upper and lower boundaries of a horizontal channel for the past week. The 50-hour simple moving average was providing resistance for the pair at 110.3 during the previous trading sessions.
Everything being equal, it is likely that the 50-hour SMA could push the cryptocurrency towards a support level at 104.36.
However, given that the ETH/USD pair is located near the upper boundary of a descending channel pattern, a breakout could be expected within this session.
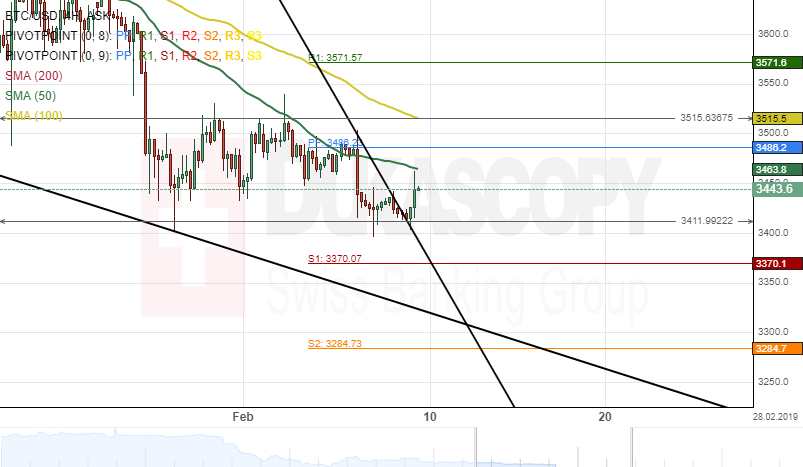
BTC/USD 4H Chart: Trading sideways
The Bitcoin cryptocurrency has been moving sideways against the US Dollar since January 29. The pair was trading between the upper and lower boundaries of a horizontal channel.
As for the near future, it is likely that the BTC/USD currency pair continues its movement down. The potential target for the blockchain will be near a traditional weekly support level at 3370.1.
However, it is expected that the pair aims for a re-test of the 50-hour simple moving average at 3464.8 during the following trading session.
Author

Dukascopy Bank Team
Dukascopy Bank SA
Dukascopy Bank stands as an innovative Swiss online banking institution, with its headquarters situated in Geneva, Switzerland.


