Patterns: BTC/USD, ETH/USD

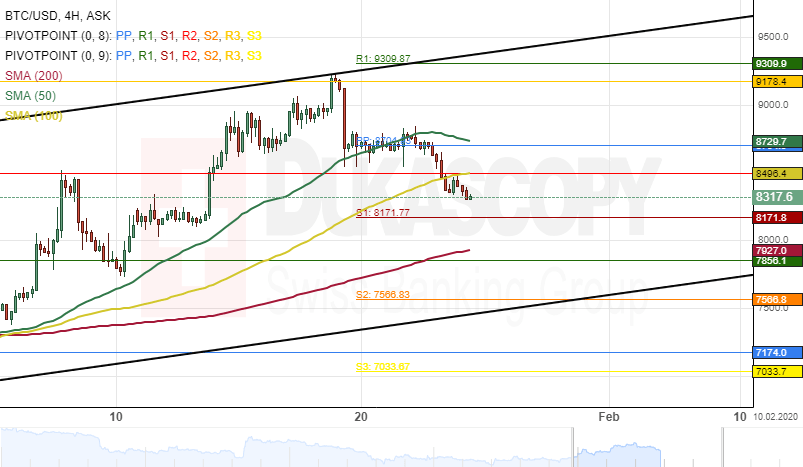
BTC/USD 4H Chart: Targets at $8000
After the Bitcoin cryptocurrency tested a resistance cluster formed by the weekly R1 and the monthly R3 at 9178.4 on January 19, the exchange rate began to decline. The pair has declined by 9.24% in value during this period.
All things being equal, the BTC/USD pair will most likely continue to decline until it reaches a support cluster formed by the 200– period simple moving average and the monthly R1 at 7915.5.
The Bitcoin cryptocurrency will likely make an upside reversal from the support cluster, as mentioned earlier, during next week's trading sessions.
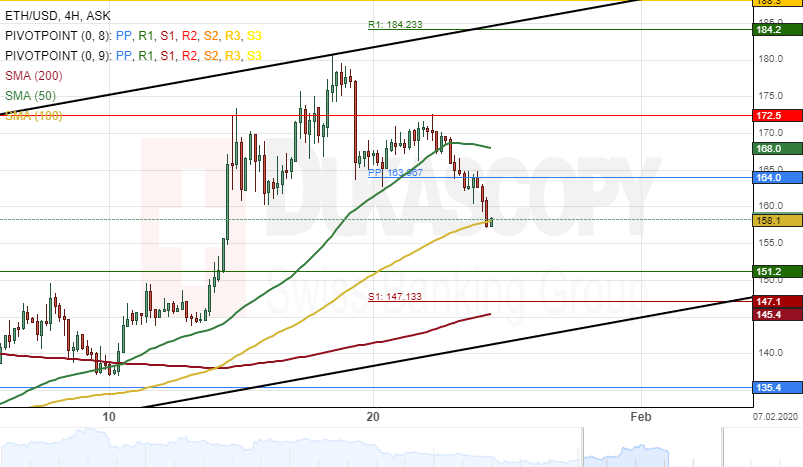
ETH/USD 4H Chart: Remains near 100
During this week's trading sessions, the Ethereum cryptocurrency has declined by 10.90% in value against the US Dollar. The exchange rate breached the 50– period simple moving average within this period.
Currently, the ETH/USD pair is trading near the support level formed by the 100– period SMA at 157.80.
If the 100– period SMA holds, bullish traders could drive the pair higher during next week's trading sessions.
However, if the cryptocurrency breaks the support level, the next target for bears would be at the 140.00 regions.
Author

Dukascopy Bank Team
Dukascopy Bank SA
Dukascopy Bank stands as an innovative Swiss online banking institution, with its headquarters situated in Geneva, Switzerland.


