On-chain records disregards Litcoin's decline, hinting at potential upswing
- While altcoins seem to be facing a slight market backlash, on-chain data suggests Litecoin's impending rally.
- Technical indicators strengthen the bullish thesis for LTC amidst the mild market sell-off.

After making tremendous efforts to test the $90 region twice, Litecoin price has plummeted considerably by 19% over the past few days. However, technical indicators present an argument that the "Bitcoin silver" could be poised for a potential upward trend.
Onchain and technical indicators reveal an incoming rally for Litecoin
One of the metrics indicating that Litecoin could still have plenty of room upwards is the MVRV. This tool, which is the quotient of the market cap and the realized cap, provides an estimated amount all existing tokens have been bought at. This is done by getting the approximate worth of all the coins in the blockchain as at when it was last moved
Onchain statistics exposing historical data identified times when the MVRV is less than 0.5 as being underpriced, conversely specifying that a value greater than 2.5 is overpriced.
This index has been seen to go above 3.0 in the 2014 and 2018 bull run that saw Litecoin make new highs. At the time of writing, the MRV sits slightly above 1.2, signifying prices could rise close to previous all-time highs' values.
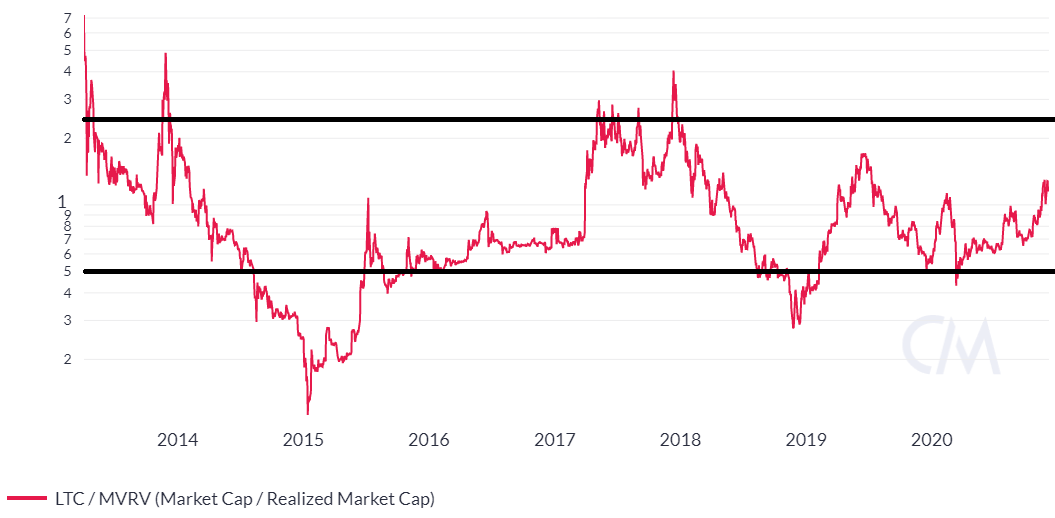
MVRV LTC
The daily transactions recorded in the Litecoin blockchain, as shown by the red line in the chart below, is indicative of the fact that the current value is nowhere near the previous 2018 peak. Although the launch of the Lightbringer, a decentralized fantasy game, accounts for the momentary spike seen on the chart. After this release, daily transactions went from 40,000 to 160,000. However, it could be seen that the current levels hover around the pre-2017 rally.
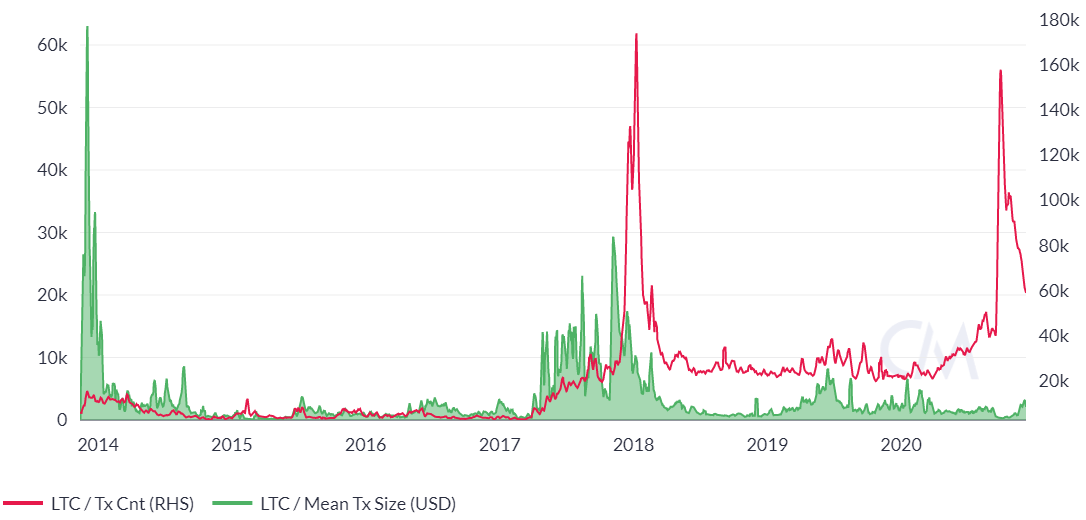
LTC Transaction rate
As shown by the green fill, the blockchain currently averages transactions of about $2,700, which is in contrast with $30,000 made towards the end of 2017.
The daily chart on the price of Litecoin calls attention to the confluence of the 50-day and 200-day exponential moving averages forming a Golden cross on October 26, for the third time this year. The previous crosses were sustained for about 45 and 27 days, respectively, before prices receded. It is worth noting that the crossing which preceded the rally in 2019 lasted about 114 days after making over 135% increase.
BTC/LTC Daily chart
Although the volume profile of visible range signals support levels are within the $43 and $65 area, the 200-day exponential moving average could serve as the short term support for Litecoin's price. The absence of a bullish or bearish divergence may confirm that LTC downward drive has lost its steam.
Author

FXStreet Team
FXStreet


