On-chain analytics point to an accumulation phase for Ethereum

On-chain data suggest that large Ethereum holders are taking advantage of the last month's correction to accumulate more coins while the retail demand for ETH does not seem to be slowing down.
It is no secret that large holders (also known as Whales) tend to be the ones affecting price action of an asset the most. In traditional finance it becomes impossible to monitor transparently how these large holders behave: Which are their balances? Are they actively buying or selling? When do they do it? For crypto assets extracting and monitoring this data is seamless since all the data is recorded on-chain and it is just a matter of processing it.
After large market movements are key moments to take a look at the behavior of these entities and how they might be positioning for the future. After the recent Crypto market’s plunge we have been taking a look at what their whales are doing. In this case specifically, for ETH, the group of investors that hold between 10k and 100k ETH in their wallets are those that control the majority of ETH with almost one fourth of the total ETH supply. This group of investors have a large influence on the price action of the asset, as can be seen in the chart below, their balance sheet in ETH continues to grow. They have been accumulating considerably, growing their total balance from 28.3M of ETH in March to 29.0M of ETH nowadays, almost 700k ETH more which is an equivalent of $1.38 billions:
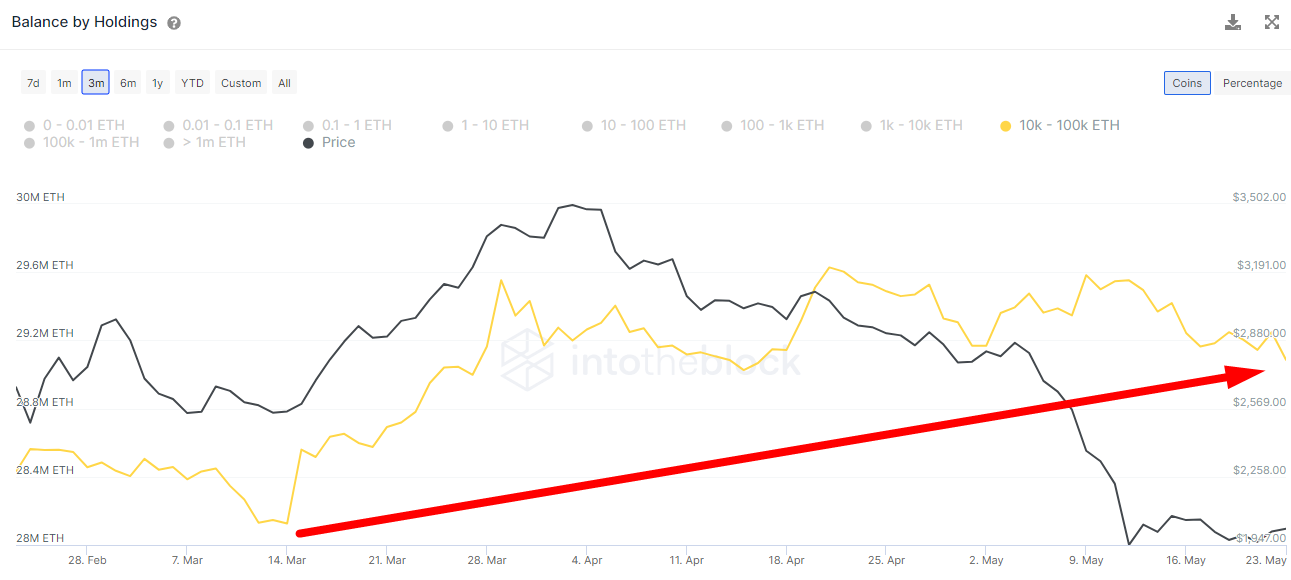
Balance by Holdings indicator as of May 24th according to IntoTheBlock
The divergence on the indicator is very clear, and this is a sign that this mass of investors might be looking to accumulate at these prices because they expect an appreciation of ETH in the future. Are they treating this market drop as an opportunity to buy at a discount and continue accumulating?
Besides what large whales are doing, the success of the Ethereum blockchain relies as well on smaller investors that decide to make use in the myriad of applications that are offered today, from decentralized finance to NFTs. An useful metric to gauge if this interest is growing or declining is to measure how many addresses there are with a modest balance of ETH, as a proxy of the retail sector. The range from 1 to 10 ETH is a perfect group to measure this, since it is what is usually a moderate balance that still allows users to interact with dApps and pay their gas costs more comfortably. As can be seen in the chart below, beside the market downturn, the addresses with ETH holdings between this range continue to grow considerably, going from 1.14 million addresses to 1.19 million addresses in just one month and a half:
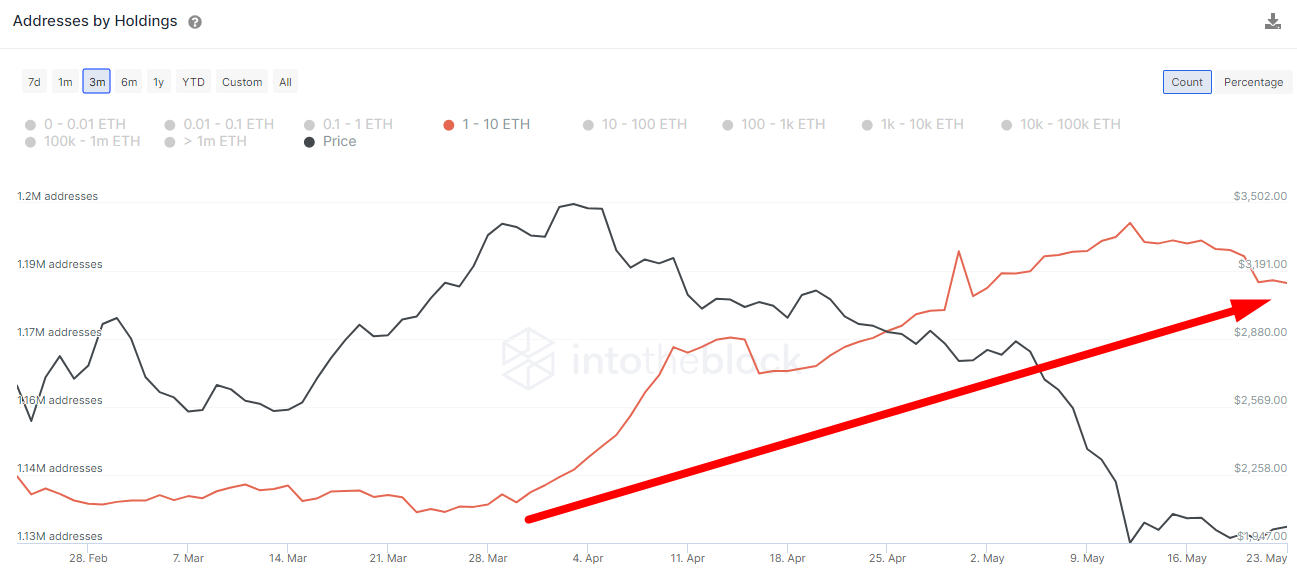
Addresses by Holding indicator as of May 24th according to IntoTheBlock.
On-chain data can be a powerful tool to discover potential support and resistance levels that could serve as a pivot point for the price action of ETH. These levels can be extracted by accounting for the average cost of ETH per each address and grouping them by price brackets. Those price brackets that show a larger amount of wallets could potentially point towards a price level where many investors might turn from a profitable to unprofitable situation, and thus the higher chance of them taking action by buying or selling their ETH and affecting price action. This computation is what is shown in the indicator below, the In/Out of the Money Around Price indicator:
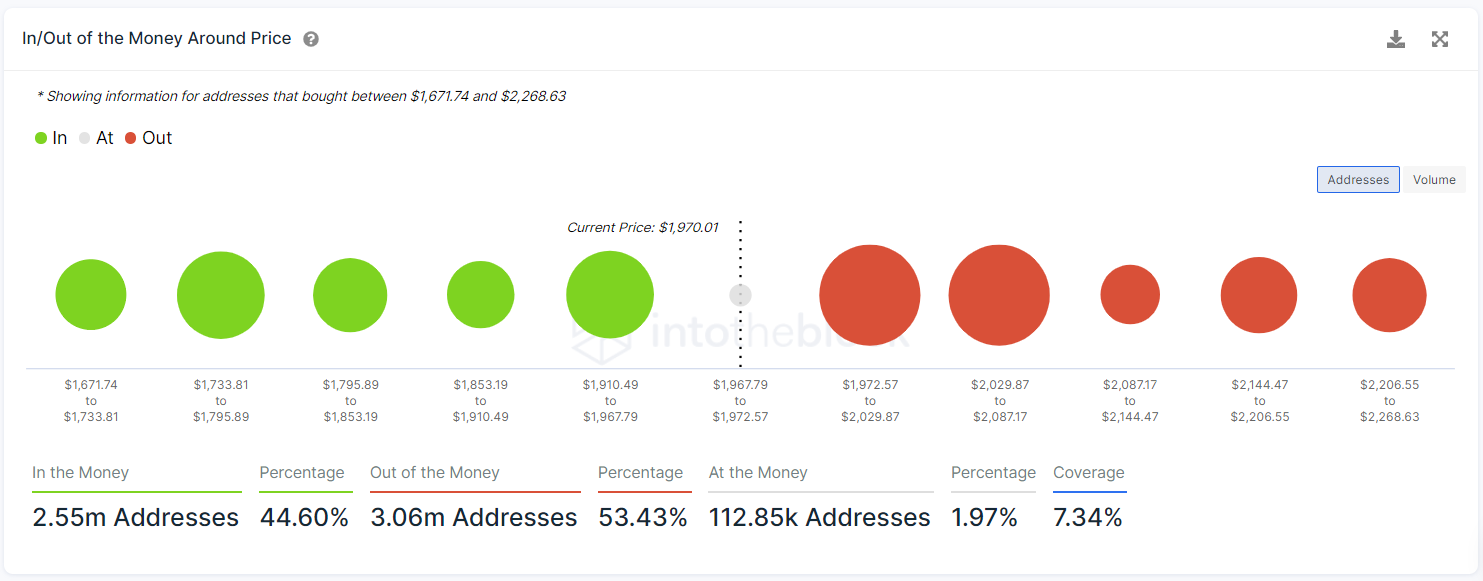
In/Out of the Money Around Price indicator as of May 24th according to IntoTheBlock.
As always, we take into consideration that each wallet might be close to one investor, although we assume there are a minority of cases where an entity might be controlling several addresses. As can be seen in the chart, there is a large part of addresses (+2 million addresses) that bought between the $1970 and $2087 price levels, so if that price resistance were broken, price could potentially extend into newer highs if conditions are positive.
Author

IntoTheBlock Team
IntoTheBlock
IntoTheBlock Team consists of a tribe of data scientists, crypto experts and AI geeks.


