Crypto Price Analysis: The recent altcoin rally could be short-lived
Crypto watchers will kick start their week with the official launch of Bakkt, the highly anticipated exchange which provides physically-settled bitcoin futures and backed by the Intercontinental Exchange. Crypto market participants have been expecting that Bakkt would further drive bitcoin’s institutional interest under a regulated environment and hopefully capital inflows to the leading cryptocurrency. Markets seem relatively calm for the new launching futures and yet we haven’t seen many price actions of bitcoin after the launch, and we will certainly keep a close eye on the development.
Speaking of institutional interest, the proposed bitcoin ETF is another focus. Investment firm VanEck and blockchain startup SolidX have been pushing for a bitcoin ETF to the SEC, although reports were saying the two companies have withdrawn its proposal, however, the move would allow the team to re-file their proposal to the SEC later, eventually buying more time to fine-tune the pitch.
Meanwhile, the Committee on Financial Services of the US House of Representatives will hold a hearing with the SEC on Tuesday (24/9) and one of the focuses would be cryptocurrency-related issues, possibly including bitcoin ETF and Facebook’s Libra project.
Price action-wise, we’ve seen bitcoin just shy of 10000 levels after dipping to the 9900 area over the weekend, while most of the altcoins retreated from the recent highs. We’ve highlighted the recent altcoin rally could be short-lived, and market focus could soon be back to bitcoin.
Price Analysis
BTC/USDT
Figure 1: BTC/USDT Daily Chart
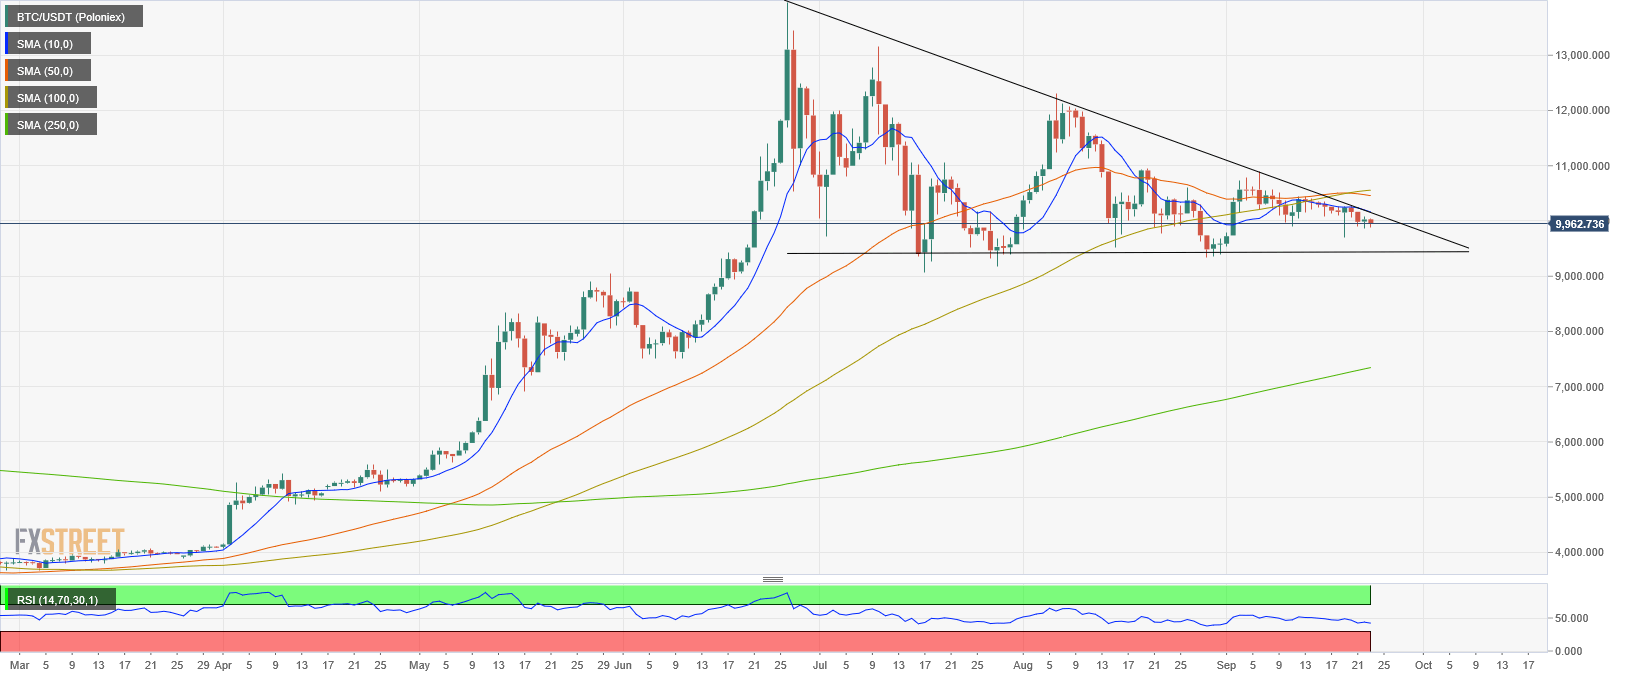
Source: FX Street
Figure 2: OKEx’s BTC Long/Short Ratio
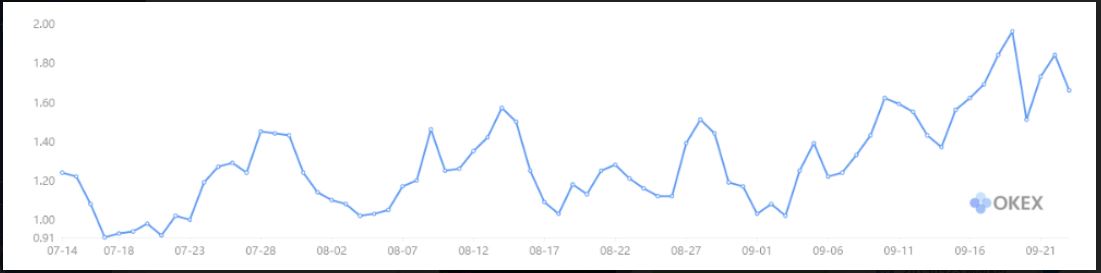
Source: OKEx
Figure 3: OKEx’s BTC Futures Open Interest and Trading Volume
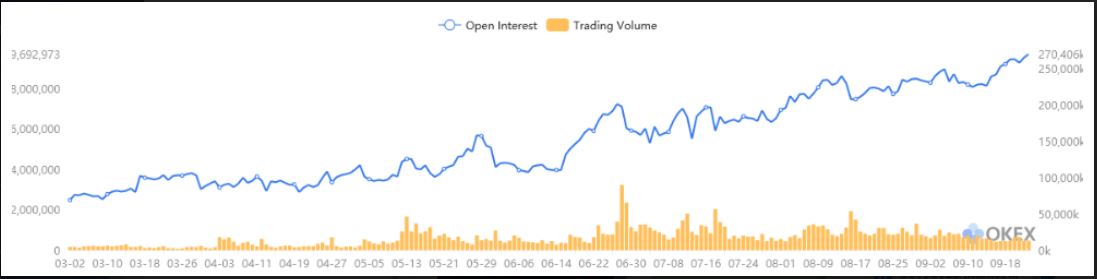
Source: OKEx
-
BTCUSDT has continued to trade in a tight range as chart and technical indicators suggest that trend is likely continuing.
-
However, there’s a silver lining as OKEx’s BTC Long/Short Ratio (figure 2) retreated from the recent high, suggesting that there could be some room for bitcoin bulls to breath, but keep in mind that the overall uptrend of the Long/Short ratio remains valid.
- Despite the low trading volume, OKEx’s BTC open interest remained high (figure 3), which would suggest that there was more willingness on one side of the market than the other.
ETHUSDT
Figure 4: ETH/USDT Daily Chart
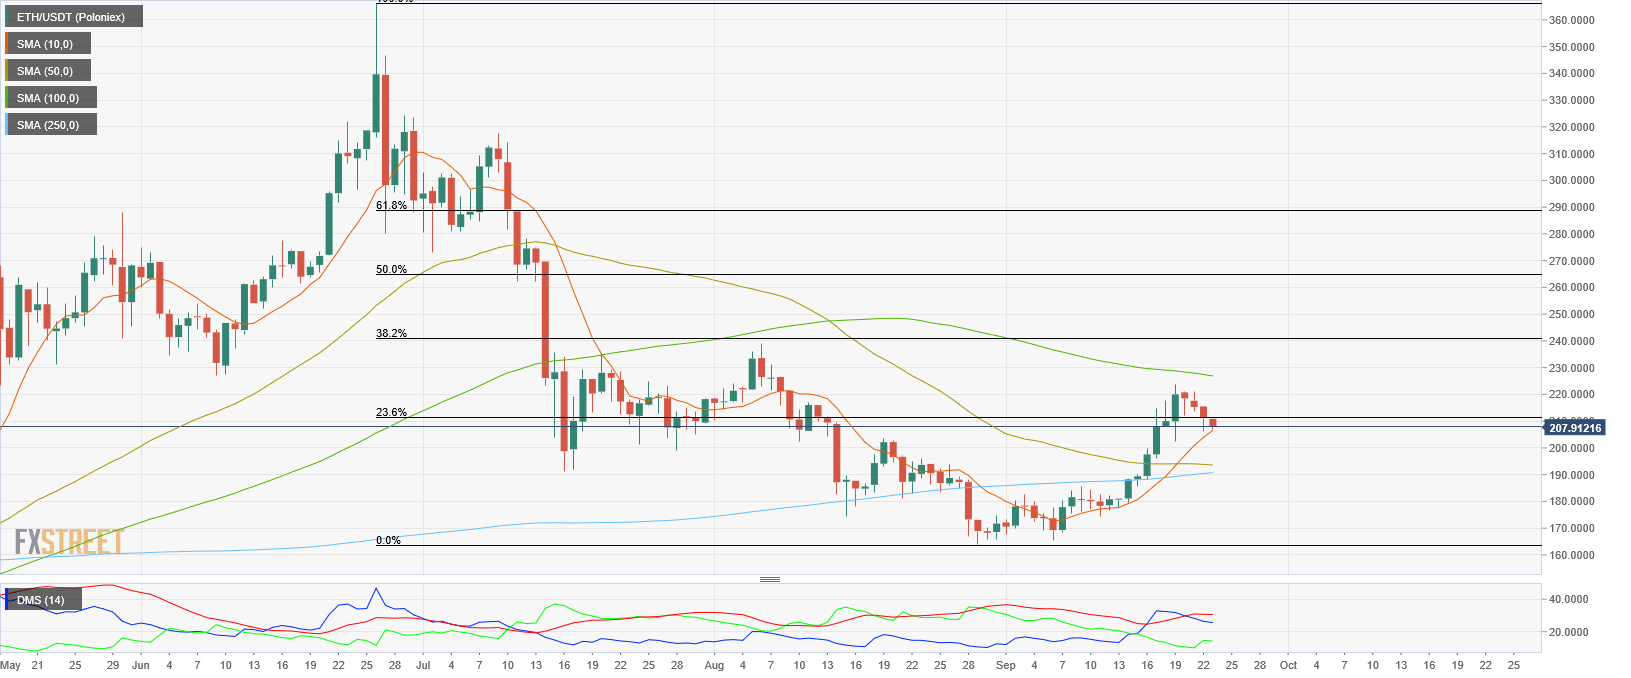
Source: FX Street
Figure 5: OKEx’s ETH Long/Short Ratio
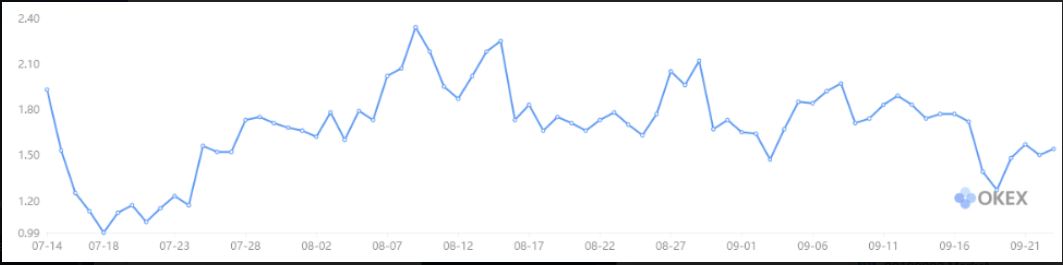
Source: OKEx
-
The pair retreated from the recent high of 223.93 and just shy below 211, which is 23.6% Fibonacci Retracement, and that level could turn into new resistance.
-
The negative line of the Directional Movement Index has been picking up while the positive line has shown tiredness, that could be a sign of the rally could slow down, or the pair needs more consolidations.
-
The readings of the technical indicators seem to match the ETH Long/Short Ratio, which jumped to 1.54 on Monday from last week low of 1.27, it indicates that traders with short positions could have higher potential profits.
DASH/USDT
Figure 6: DASH/USDT Daily Chart
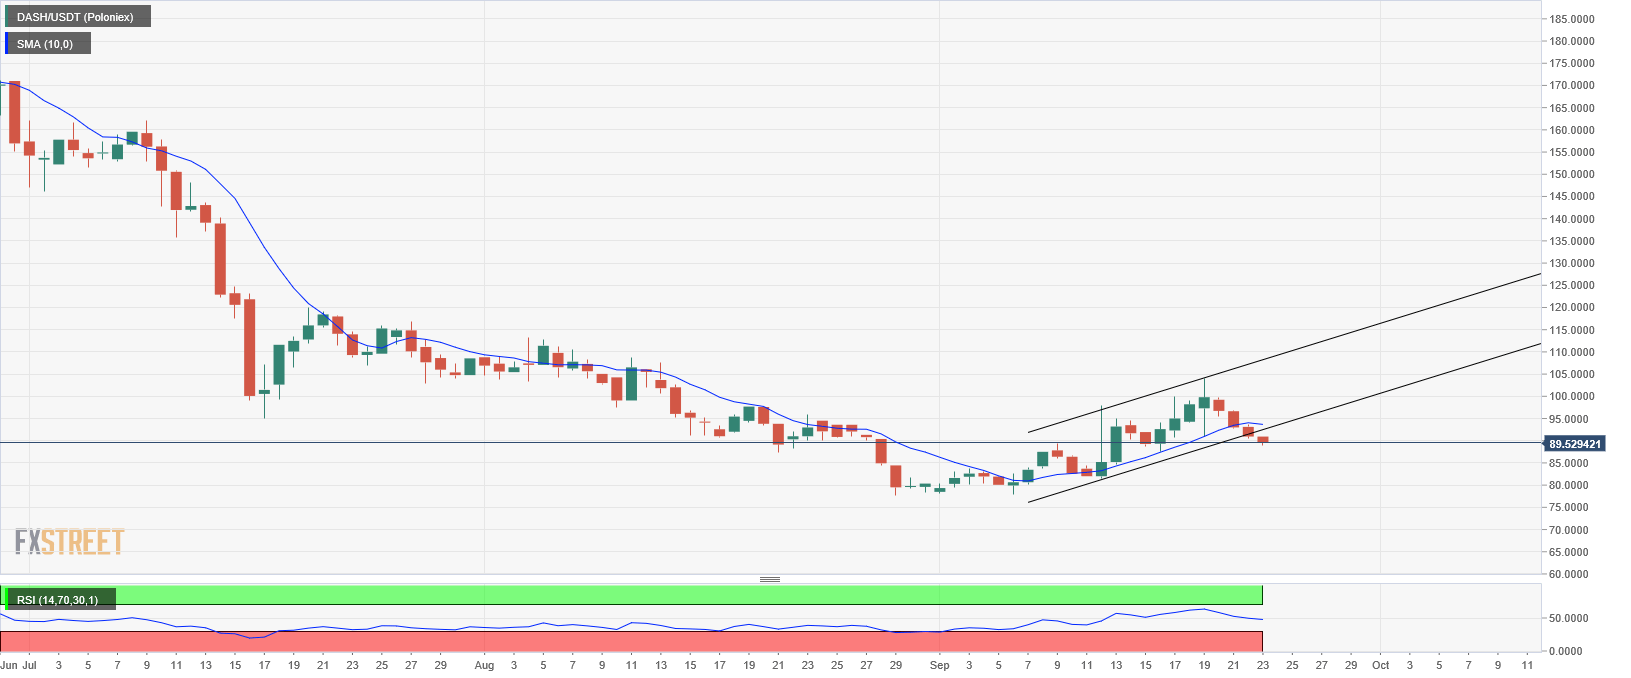
Source: FX Street
-
DASH was one of the laggers in the altcoin space, it has traded 3.5% lower against USDT on Monday trading.
-
Despite the recent retreat of altcoins, only a handful of pairs have traded below the 10-day SMA and DASHUSDT is one of them.
-
The pair has been testing the support of the lower end of the recent uptrend and 87 areas are key to watch.
ACTUSDT
Figure 7: ACTUSDT Daily Chart
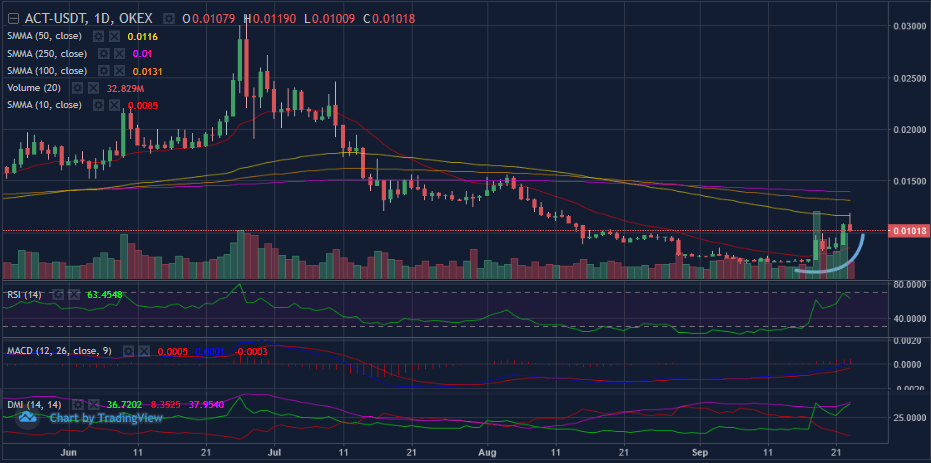
Source: OKEx; Tradingview
-
Some of the mid/small cap altcoins remained interesting. We’ve seen ACTUSDT (figure 7) has stayed in a bullish formation with trade volume spiked up to the highest level since May 2019.
-
With the recent price actions, Achain’s total market cap has returned to over 10 million dollars, the highest since August, that’s according to coinmarketcap.
-
The pair seems trying to reclaim the 50-day SMA area, which is near 0.0116.
Author

Cyrus Ip
OKEx
Cyrus Ip has the privilege to work with OKEx as a Research Analyst, where he found some of the brightest talents in the crypto space.


