Official Trump Price Forecast: TRUMP eyes rebound as bullish momentum builds near key support zone
- Official Trump price ticks down on Tuesday, nearing its previously broken trendline, which could act as a key support level.
- Sideline investors looking to accumulate TRUMP tokens could do so in the $7.95 and $6.73 support zones.
- Rising Open Interest and trading volume, alongside strengthening momentum indicators, support the likelihood of a bullish recovery.

Official Trump (TRUMP) trades slightly down to $8.31 at the time of writing on Tuesday, nearing its previously broken trendline, which could act as support. Rising open interest, increasing trading volume, and positive momentum indicators further reinforce the potential for an upward move if buyers step in around the key accumulation zone.
TRUMP’s on-chain and derivatives data points to strengthening bullish sentiment
Futures’ OI in TRUMP meme coin at exchanges rose from $227.65 million on Sunday to $328.24 million on Tuesday and has been consistently rising. Rising OI represents new or additional money entering the market and new buying, which could fuel the current TRUMP price rally.
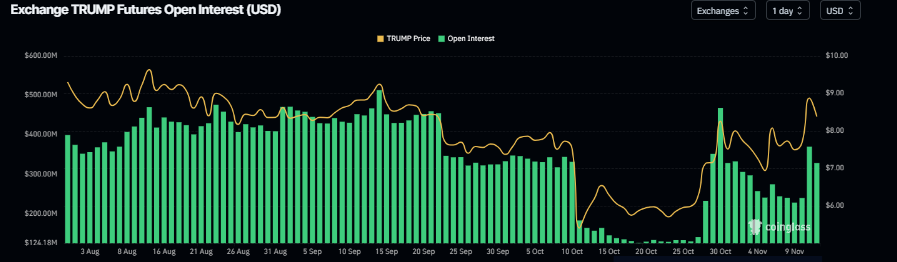
Santiment data indicate that the Official Trump ecosystem’s trading volume (the aggregate trading volume generated by all exchange applications on the chain) reached $1.8 billion on Tuesday, the highest level since the end of October. This volume rise indicates a surge in traders’ interest and liquidity in TRUMP memecoin, boosting its bullish outlook.
 [13-1762849331230-1762849331231.38.06, 11 Nov, 2025].png)
Official Trump Price Forecast: TRUMP could rebound if key support holds
Official Trump price broke above the descending trendline (drawn by connecting multiple highs since mid-July) on Monday and rose by more than 15% that day. At the time of writing on Tuesday, TRUMP trades slightly down at around $8.31.
Sideline investors looking to accumulate TRUMP tokens could do so in the $7.95 and $6.73 support zones, which are the 61.8% and 50% Fibonacci retracement levels, respectively, and roughly coincide with the 50-day and 100-day EMA levels, respectively.
If TRUMP finds support around the abovementioned levels, it could extend the rally toward the July 21 high of $11.92.
The Relative Strength Index (RSI) on the daily chart is 58, above the neutral 50 level, indicating bullish momentum gaining traction. The Moving Average Convergence Divergence (MACD) showed a bullish crossover last week, which remains intact, suggesting the continuation of an upward trend.
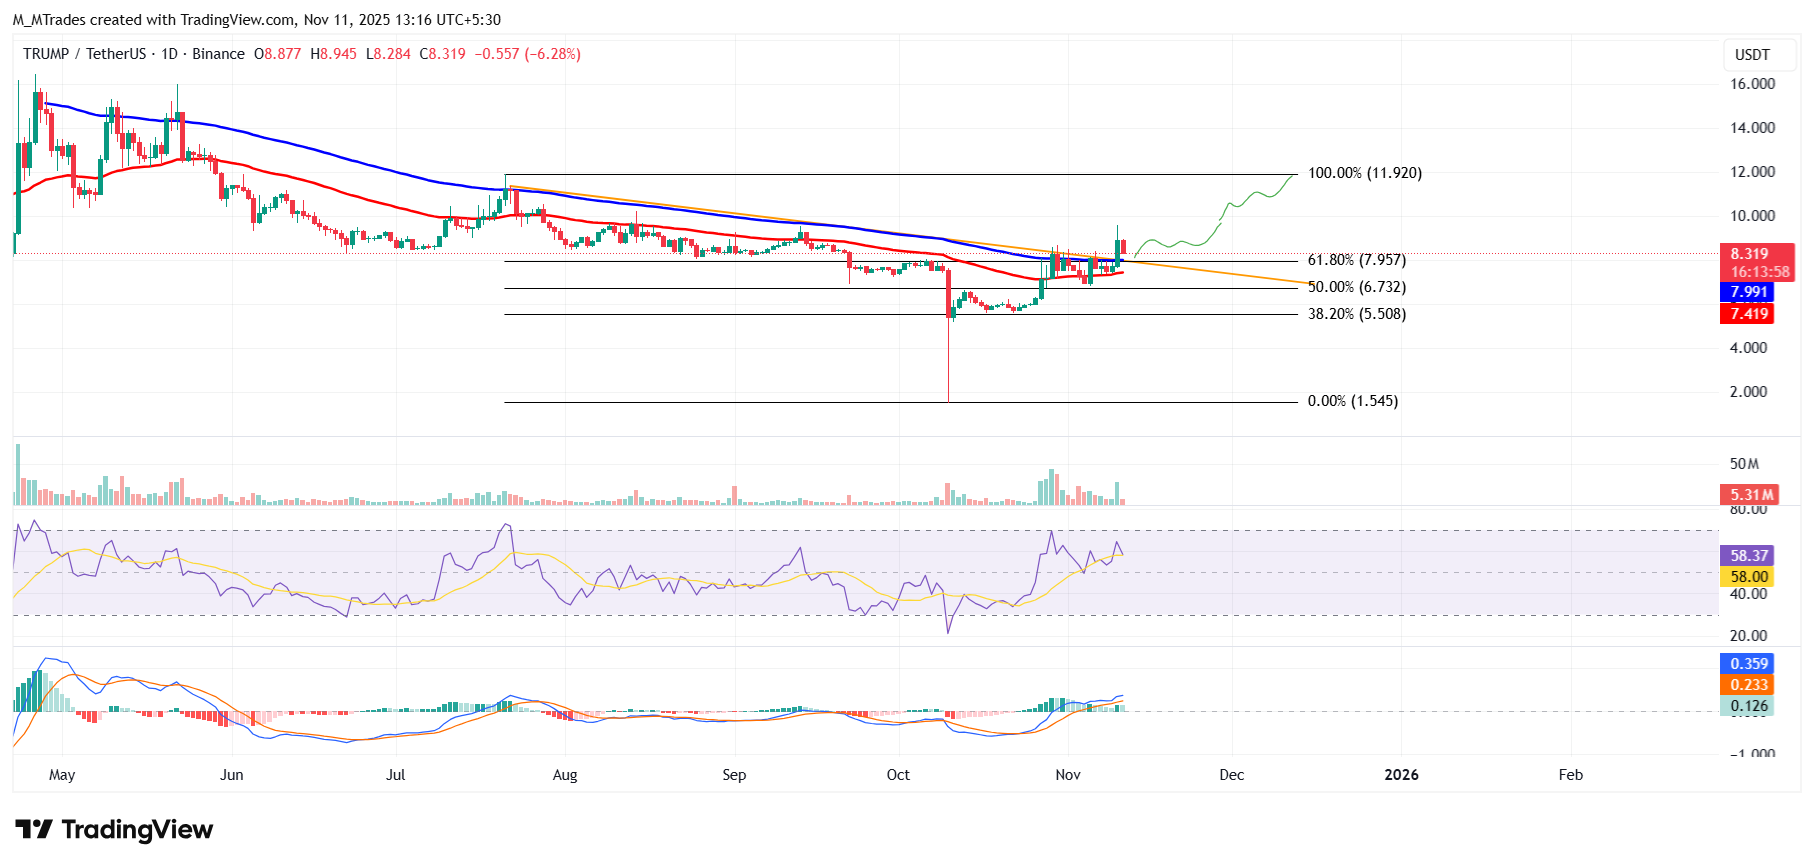
On the other hand, if TRUMP closes below the $6.73 support level, it could extend the decline toward the next support at $5.50.
Author

Manish Chhetri
FXStreet
Manish Chhetri is a crypto specialist with over four years of experience in the cryptocurrency industry.



