Pancake Price Forecast: CAKE surges as deflationary burn and bullish momentum fuel optimism
- PancakeSwap approaches a key resistance zone, with a decisive close likely to confirm further upside potential.
- On-chain data shows a weekly deflationary burn of 1.28 million CAKE tokens alongside positive funding rates, indicating bullish sentiment.
- The technical outlook suggests strengthening bullish momentum, signaling potential for further gains.

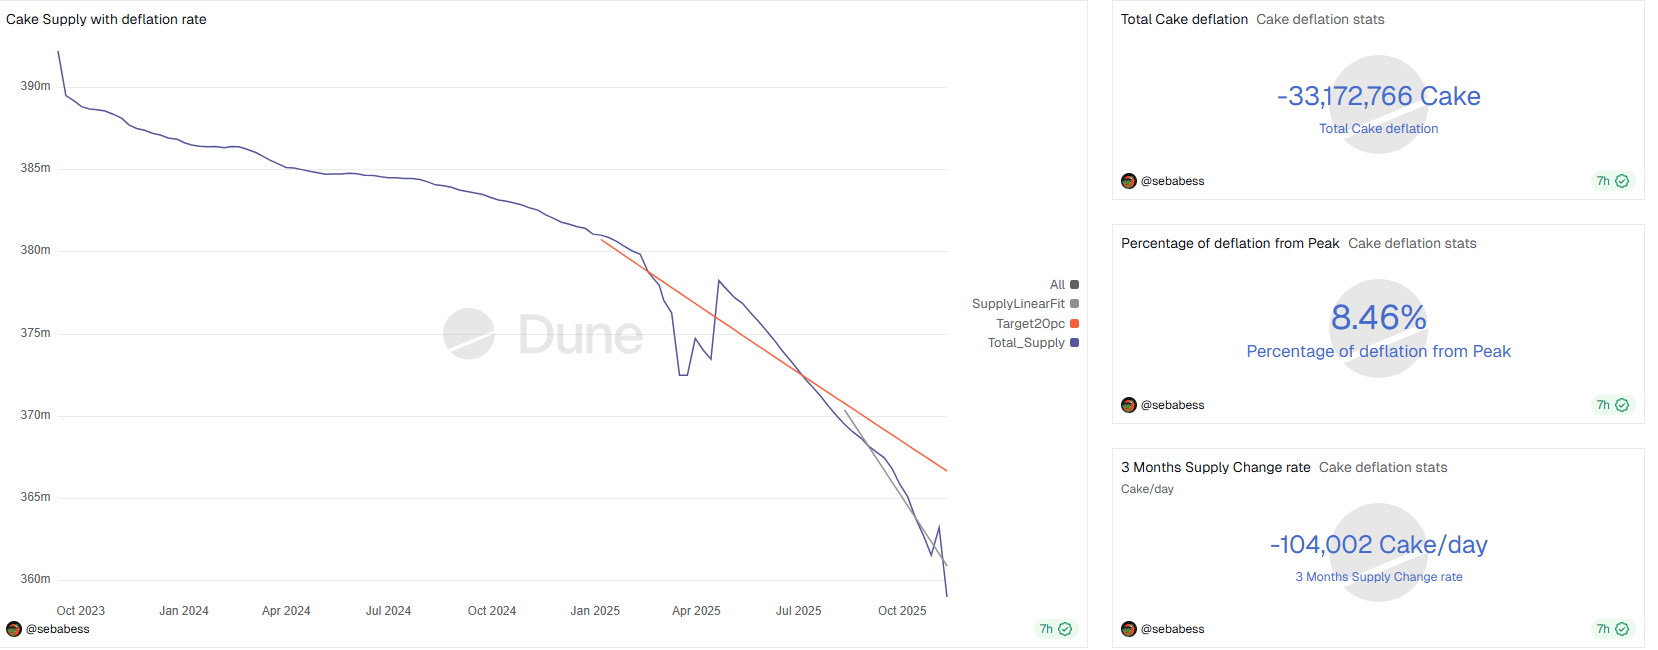
PancakeSwap (CAKE) is showing bullish intent as it approaches key resistance at $2.66 at the time of writing on Tuesday. On-chain data supports the positive outlook, highlighting a weekly deflationary burn of 1.28 million tokens that reduced CAKE’s total supply to 359 million. Meanwhile, positive funding rates and strengthening momentum indicators suggest that CAKE could be gearing up for another leg higher if it secures a decisive close above resistance.
PancakeSwap’s deflationary burn and positive funding rates suggest a bullish bias
Dune analytics data shows that a weekly deflationary burn for PancakeSwap's native token, reduced total supply by 1.28 million tokens to 359 million, outpacing emissions from trading fees and protocol mechanisms. This indicates that CAKE’s tokenomics are entering a more sustainable phase, with supply contraction potentially supporting upward price pressure.
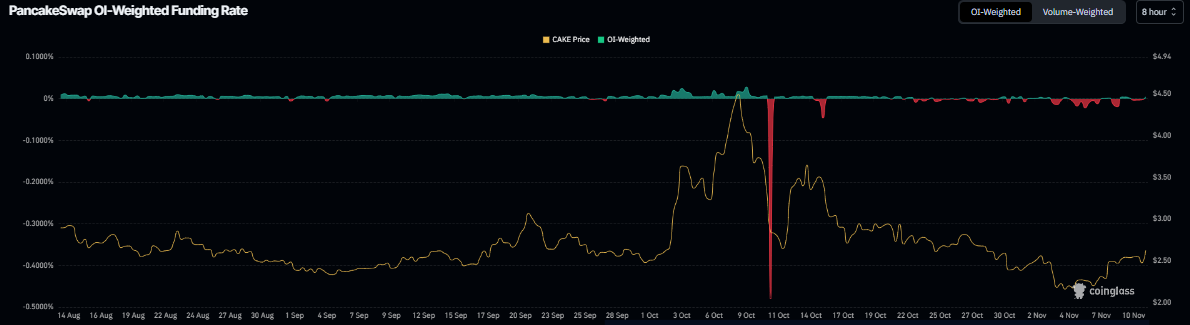
On the derivatives side, CAKE appears poised for a recovery rally, as Coinglass’s OI-Weighted Funding Rate data shows that the number of traders betting that the price of CAKE will slide further is lower than those anticipating a price increase.
The metric has flipped to a positive rate, standing at 0.0041% on Tuesday, indicating that longs are paying shorts. Historically, as shown in the chart below, when the funding rates have flipped from negative to positive, PancakeSwap’s price has rallied sharply.
PancakeSwap Price Forecast: CAKE bulls aiming for $3.42 mark
PancakeSwap price found support around the weekly level at $2.13 on November 5 and rose more than 16% until Monday. At the time of writing on Tuesday, CAKE continues to trade higher, nearing its 50-day EMA at $2.69, which roughly coincides with the previously broken trendline.
If CAKE closes above the 50-day EMA at $2.69 on a daily basis, it could extend the rally toward the 61.8% Fibonacci retracement level at $3.42.
The Relative Strength Index (RSI) on the daily chart is 51, above the neutral 50 level, indicating bullish momentum gaining traction. The Moving Average Convergence Divergence (MACD) showed a bullish crossover last week, which remains intact, suggesting the continuation of an upward trend.
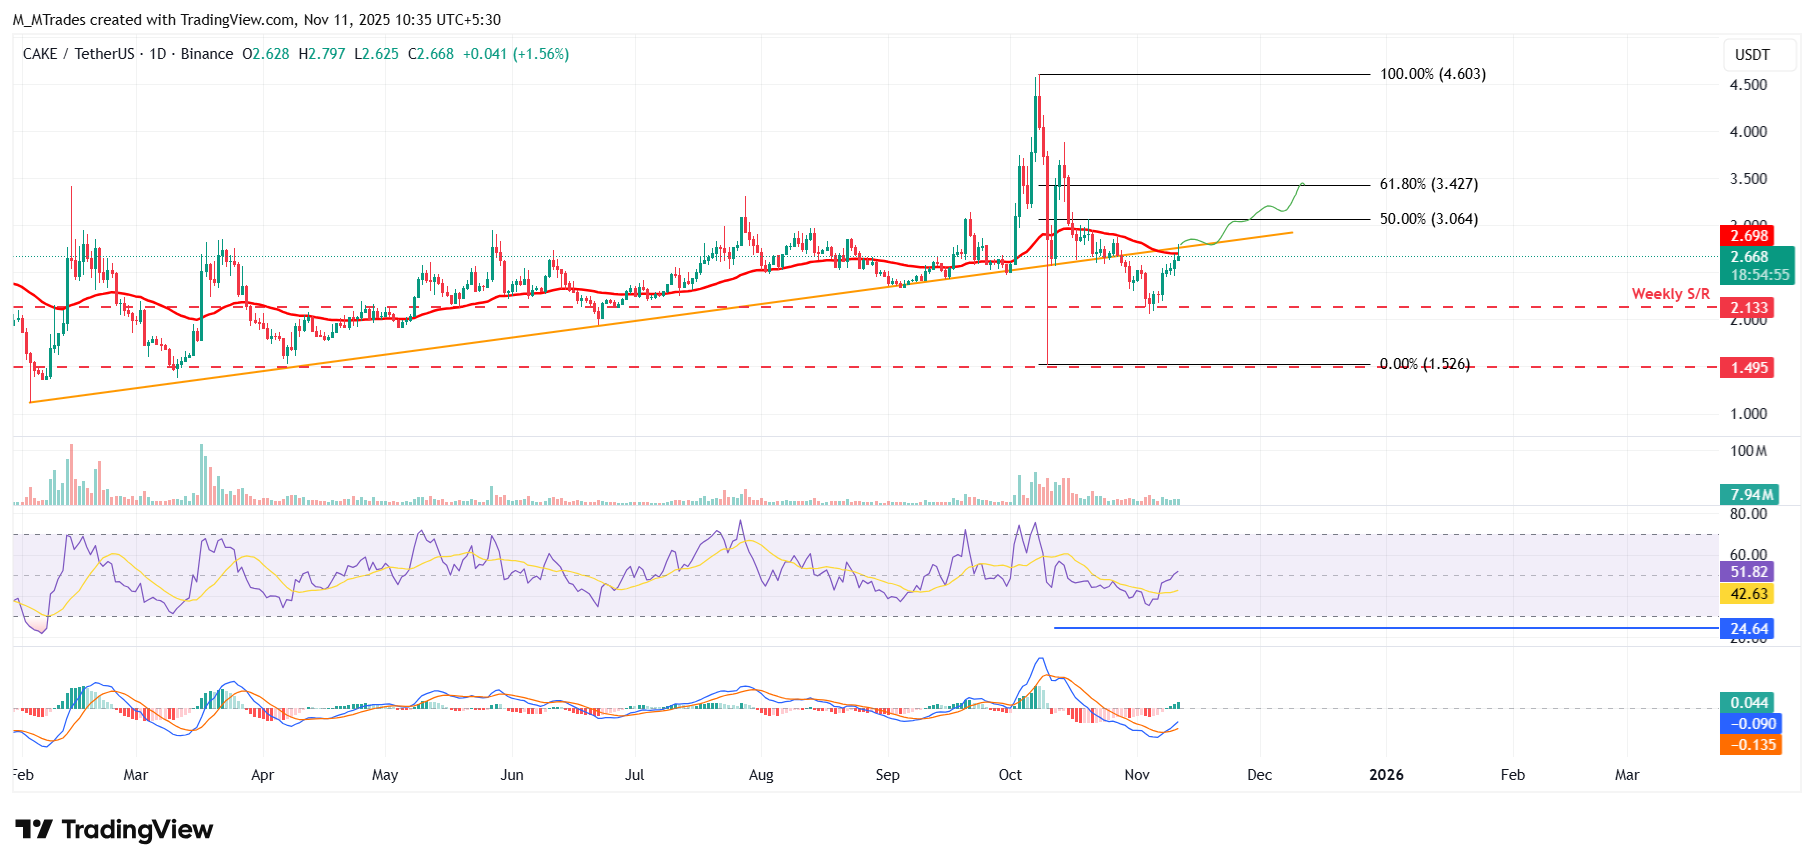
On the other hand, if CAKE faces a correction, it could extend the decline toward the weekly support at $2.13.
Author

Manish Chhetri
FXStreet
Manish Chhetri is a crypto specialist with over four years of experience in the cryptocurrency industry.


