Neo price analysis: NEO/USD sandwiched between SMA 20 and SMA 200 curves
- The MACD indicator shows increasing bearish momentum.
- The Elliott Oscillator has had three consecutive red sessions.

NEO/USD is about to chart its third straight bearish day. Over this period, NEO/USD fell from $12.40 to $11.24. The latest session is sandwiched between the 20-day Simple Moving Average (SMA 20) on the upside and the SMA 200 on the downside. Before this, NEO/USD had enjoyed a steady rise following Chinese President Xi Jinping’s positive comments on the blockchain technology.
NEO/USD daily chart
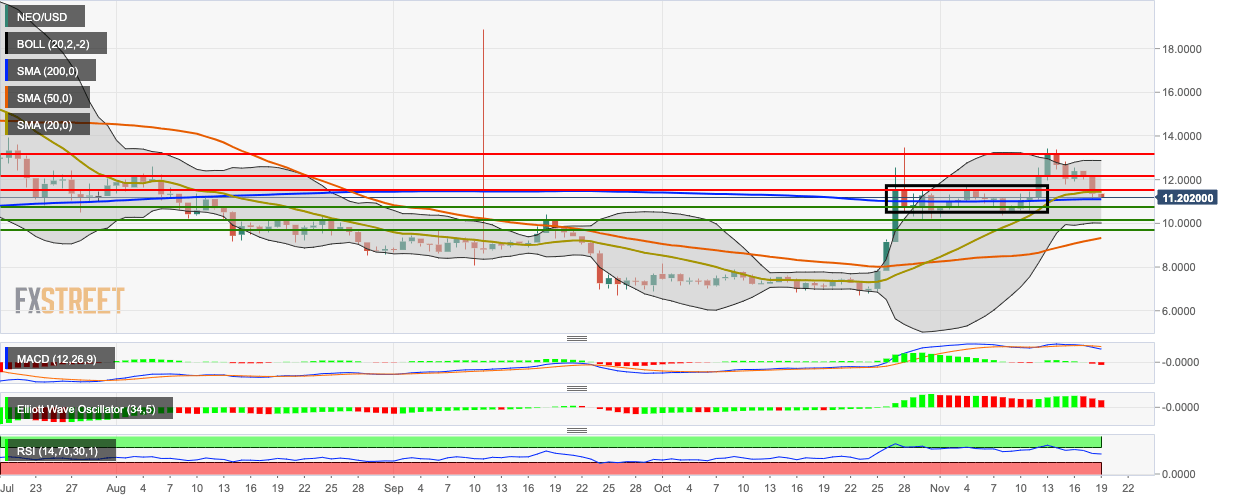
The 20-day Bollinger jaw has narrowed, indicating decreasing market volatility, while the Moving Average Convergence/Divergence (MACD) indicates decreasing bearish momentum. The Elliott Oscillator has had three consecutive red sessions and the Relative Strength Index (RSI) indicator is trending around 54.05.
Author

Rajarshi Mitra
Independent Analyst
Rajarshi entered the blockchain space in 2016. He is a blockchain researcher who has worked for Blockgeeks and has done research work for several ICOs. He gets regularly invited to give talks on the blockchain technology and cryptocurrencies.


