Near Protocol Price Forecast: NEAR rallies as on-chain demand grows on Intent layer
- Near Protocol records a 10% rise on Friday, breaking out of a short-term falling channel pattern.
- Near Intents' layer trading volume nears $4 billion, indicating increased on-chain demand for swaps.
- The NEAR futures Open Interest records a 65% surge within 24 hours, signaling strong retail demand.

Near Protocol (NEAR) edges higher by 10% at press time on Friday, underpinned by the rising trading volume on its Intent layer, which is approaching $4 billion. Furthermore, the retail interest catches up with the on-chain demand surge as the short-term recovery breaks out of a falling channel pattern.
Near Intent’s layer heats up with fresh liquidity
Near Protocol’s Intent layer is a transaction system that automates on-chain swaps by a network of solvers for cross-chain operations. The all-time trading volume on the layer stands at $3.89 billion as of Friday, which indicates increased adoption.
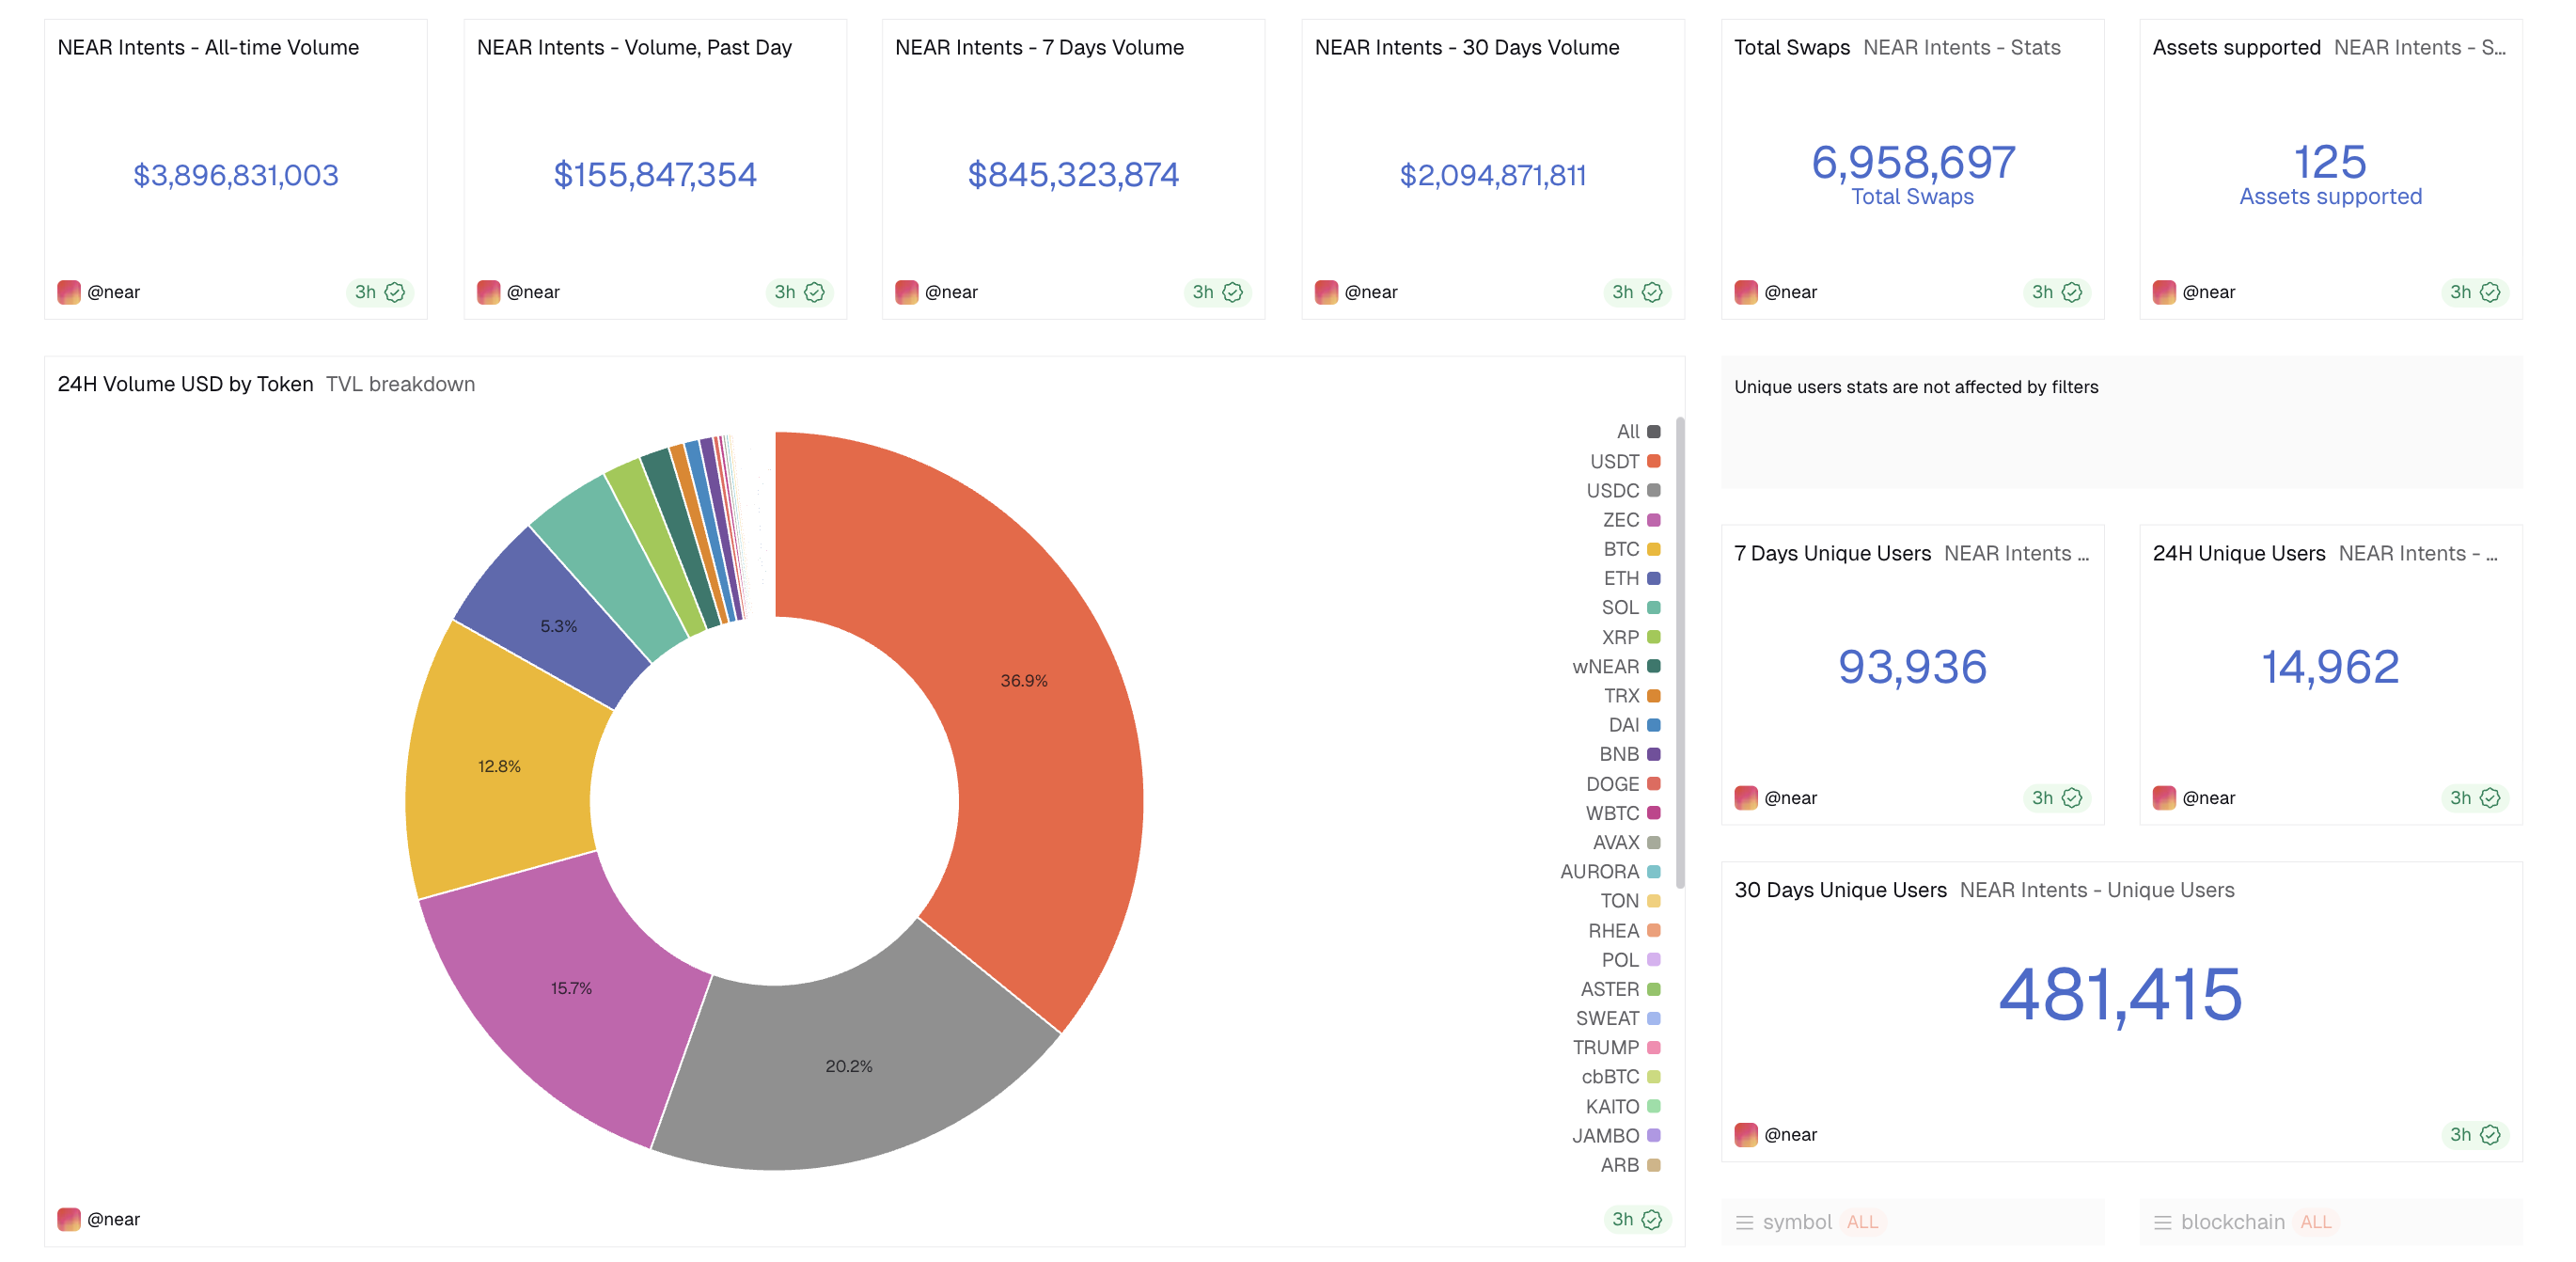
Two of the largest trading volume days were recorded on Tuesday and Thursday, with $200 million and $155 million, respectively. Out of the total volume, Bitcoin (BTC) and Zcash (ZEC) were the most actively traded assets, except for the movement of stablecoins, including USDT and USDC.
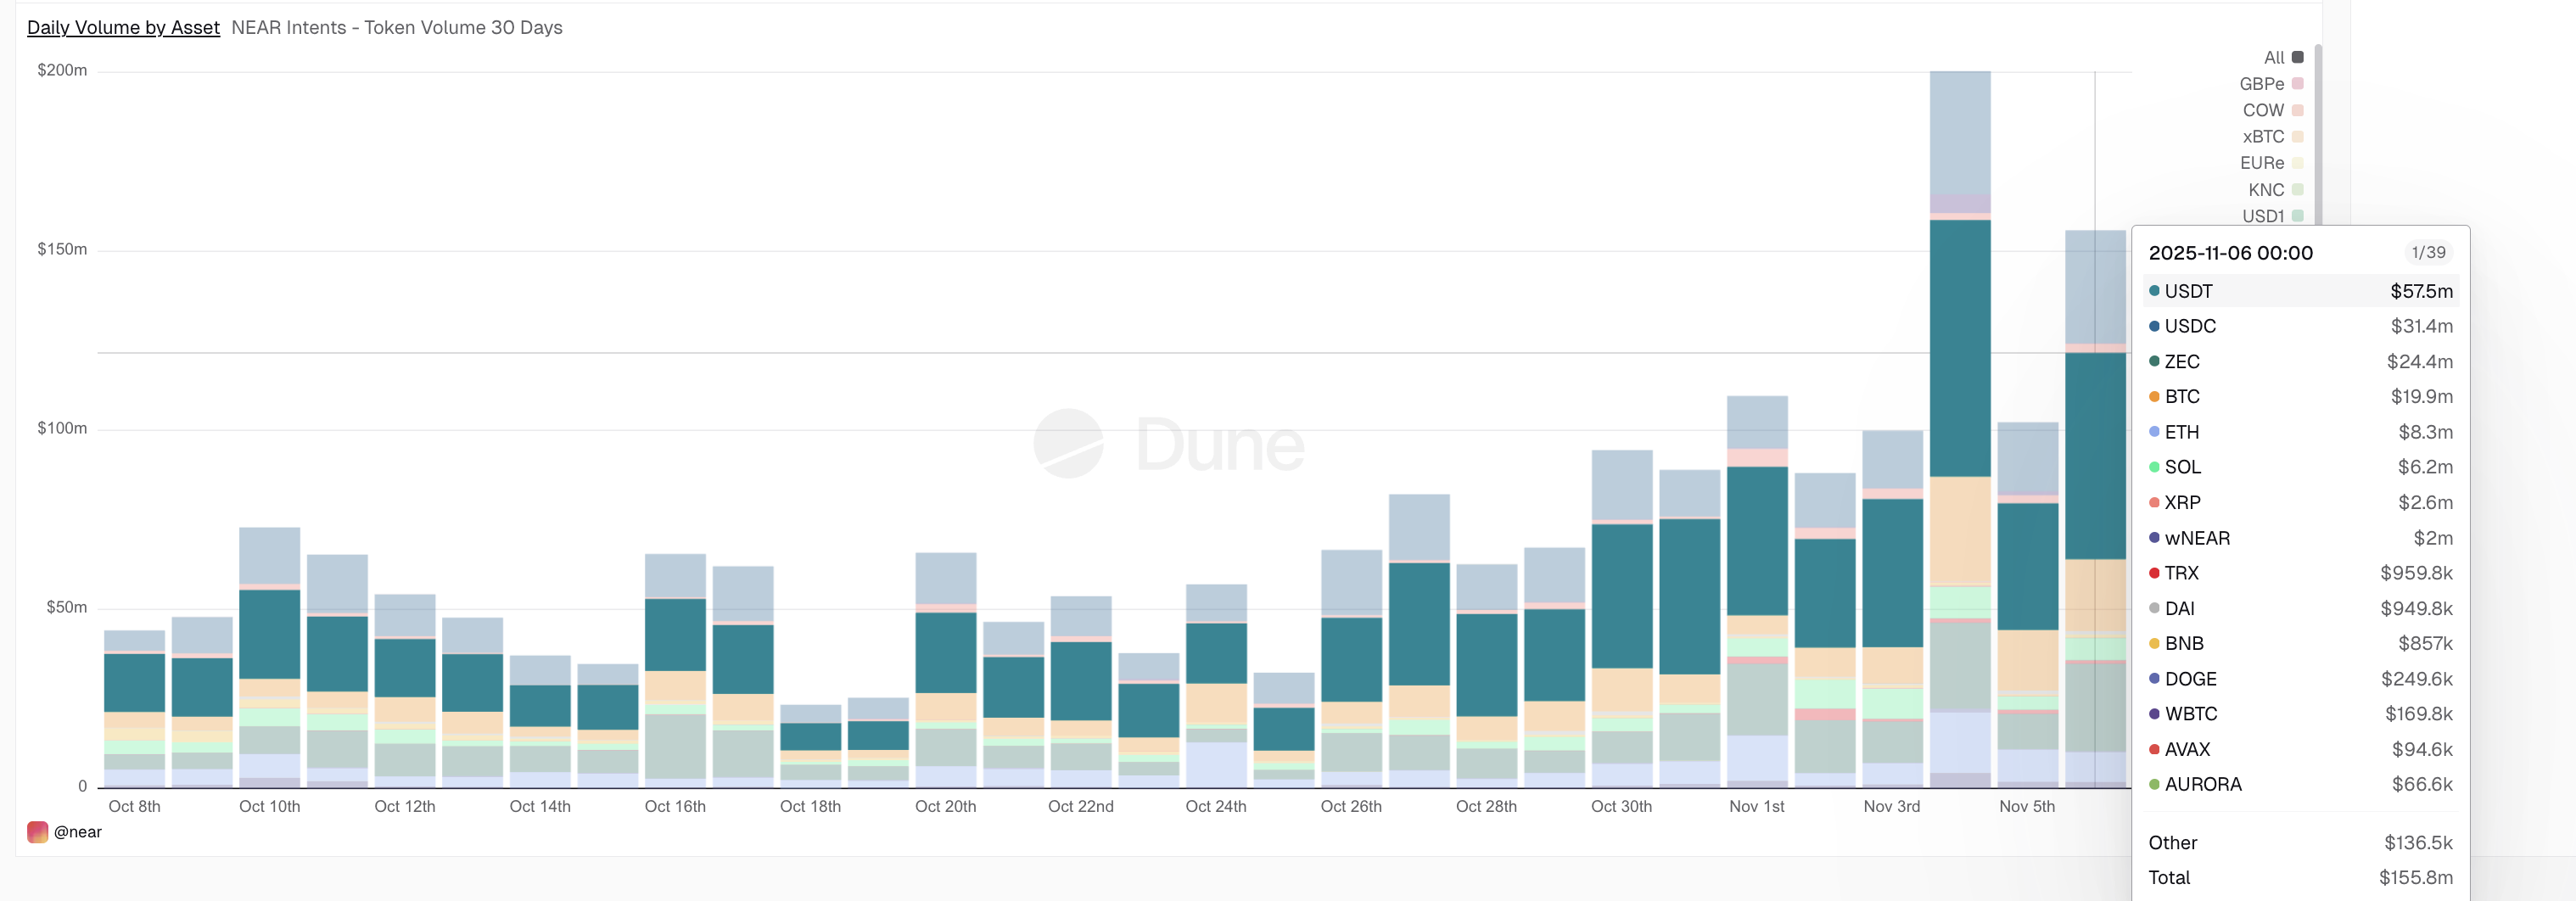
However, the Intent offers gas abstraction, enabling fees and settlement to be paid in stablecoins like USDT and USDC. Hence, the demand for NEAR is limited on its Intent layer to transactions settled with the native token.
Near Protocol’s breakout rally gains momentum
Near Protocol advances the recovery run for the third consecutive day, breaking out of a short-term descending channel on the daily chart. The breakout rally approaches the 50-day Exponential Moving Average (EMA) at $2.380.
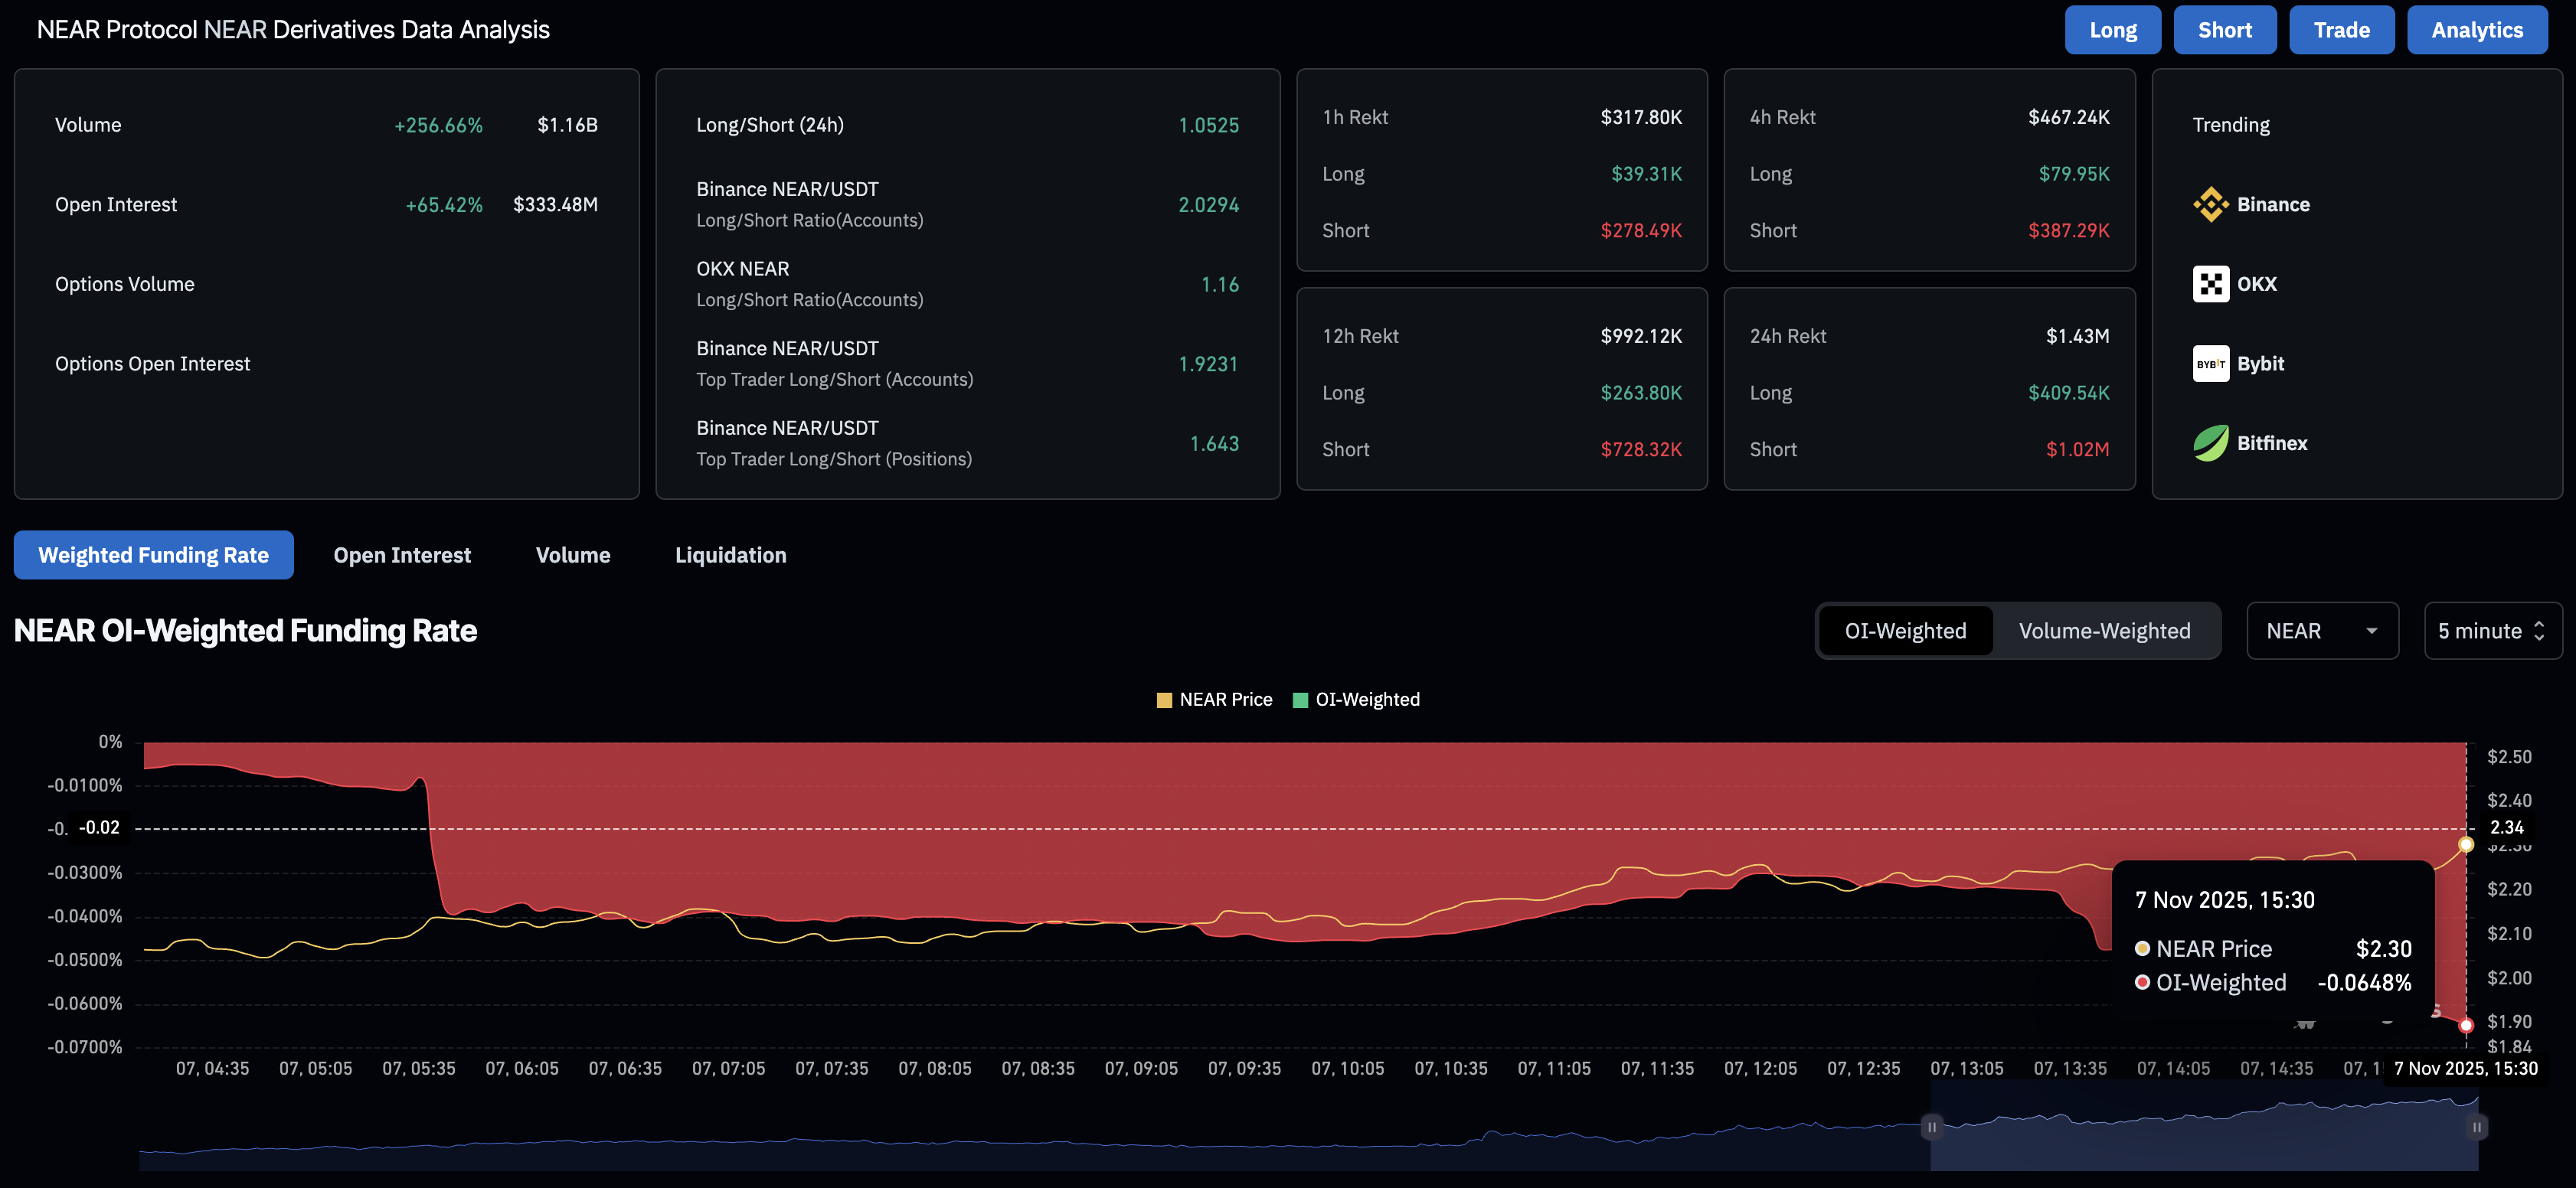
Furthermore, retail interest in NEAR is increasing, emerging from a trapped descending range. CoinGlass data shows that the NEAR futures Open Interest (OI) increased by 65% in the last 24 hours to $333.48 million, suggesting that traders are increasing their risk exposure.
Meanwhile, the OI-weighted funding rates at -0.0648% suggest that bears are paying a premium to hold short positions that could further incentivize bulls to increase risk exposure.
A decisive close above $2.380 could face opposition from the 50% Fibonacci retracement level at $2.446, drawn from the September 19 high of $3.342 to the October 10 low of $1.550. Beyond this, the uptrend could target the 200-day EMA at $2.705, followed by the $3.342 high.
Corroborating the rally, the technical indicators on the daily chart indicate a rise in buying pressure as the Relative Strength Index (RSI) reads 52, crossing above the midpoint line. Furthermore, the Moving Average Convergence Divergence (MACD) crosses above the signal line, triggering a bullish shift in trend momentum.
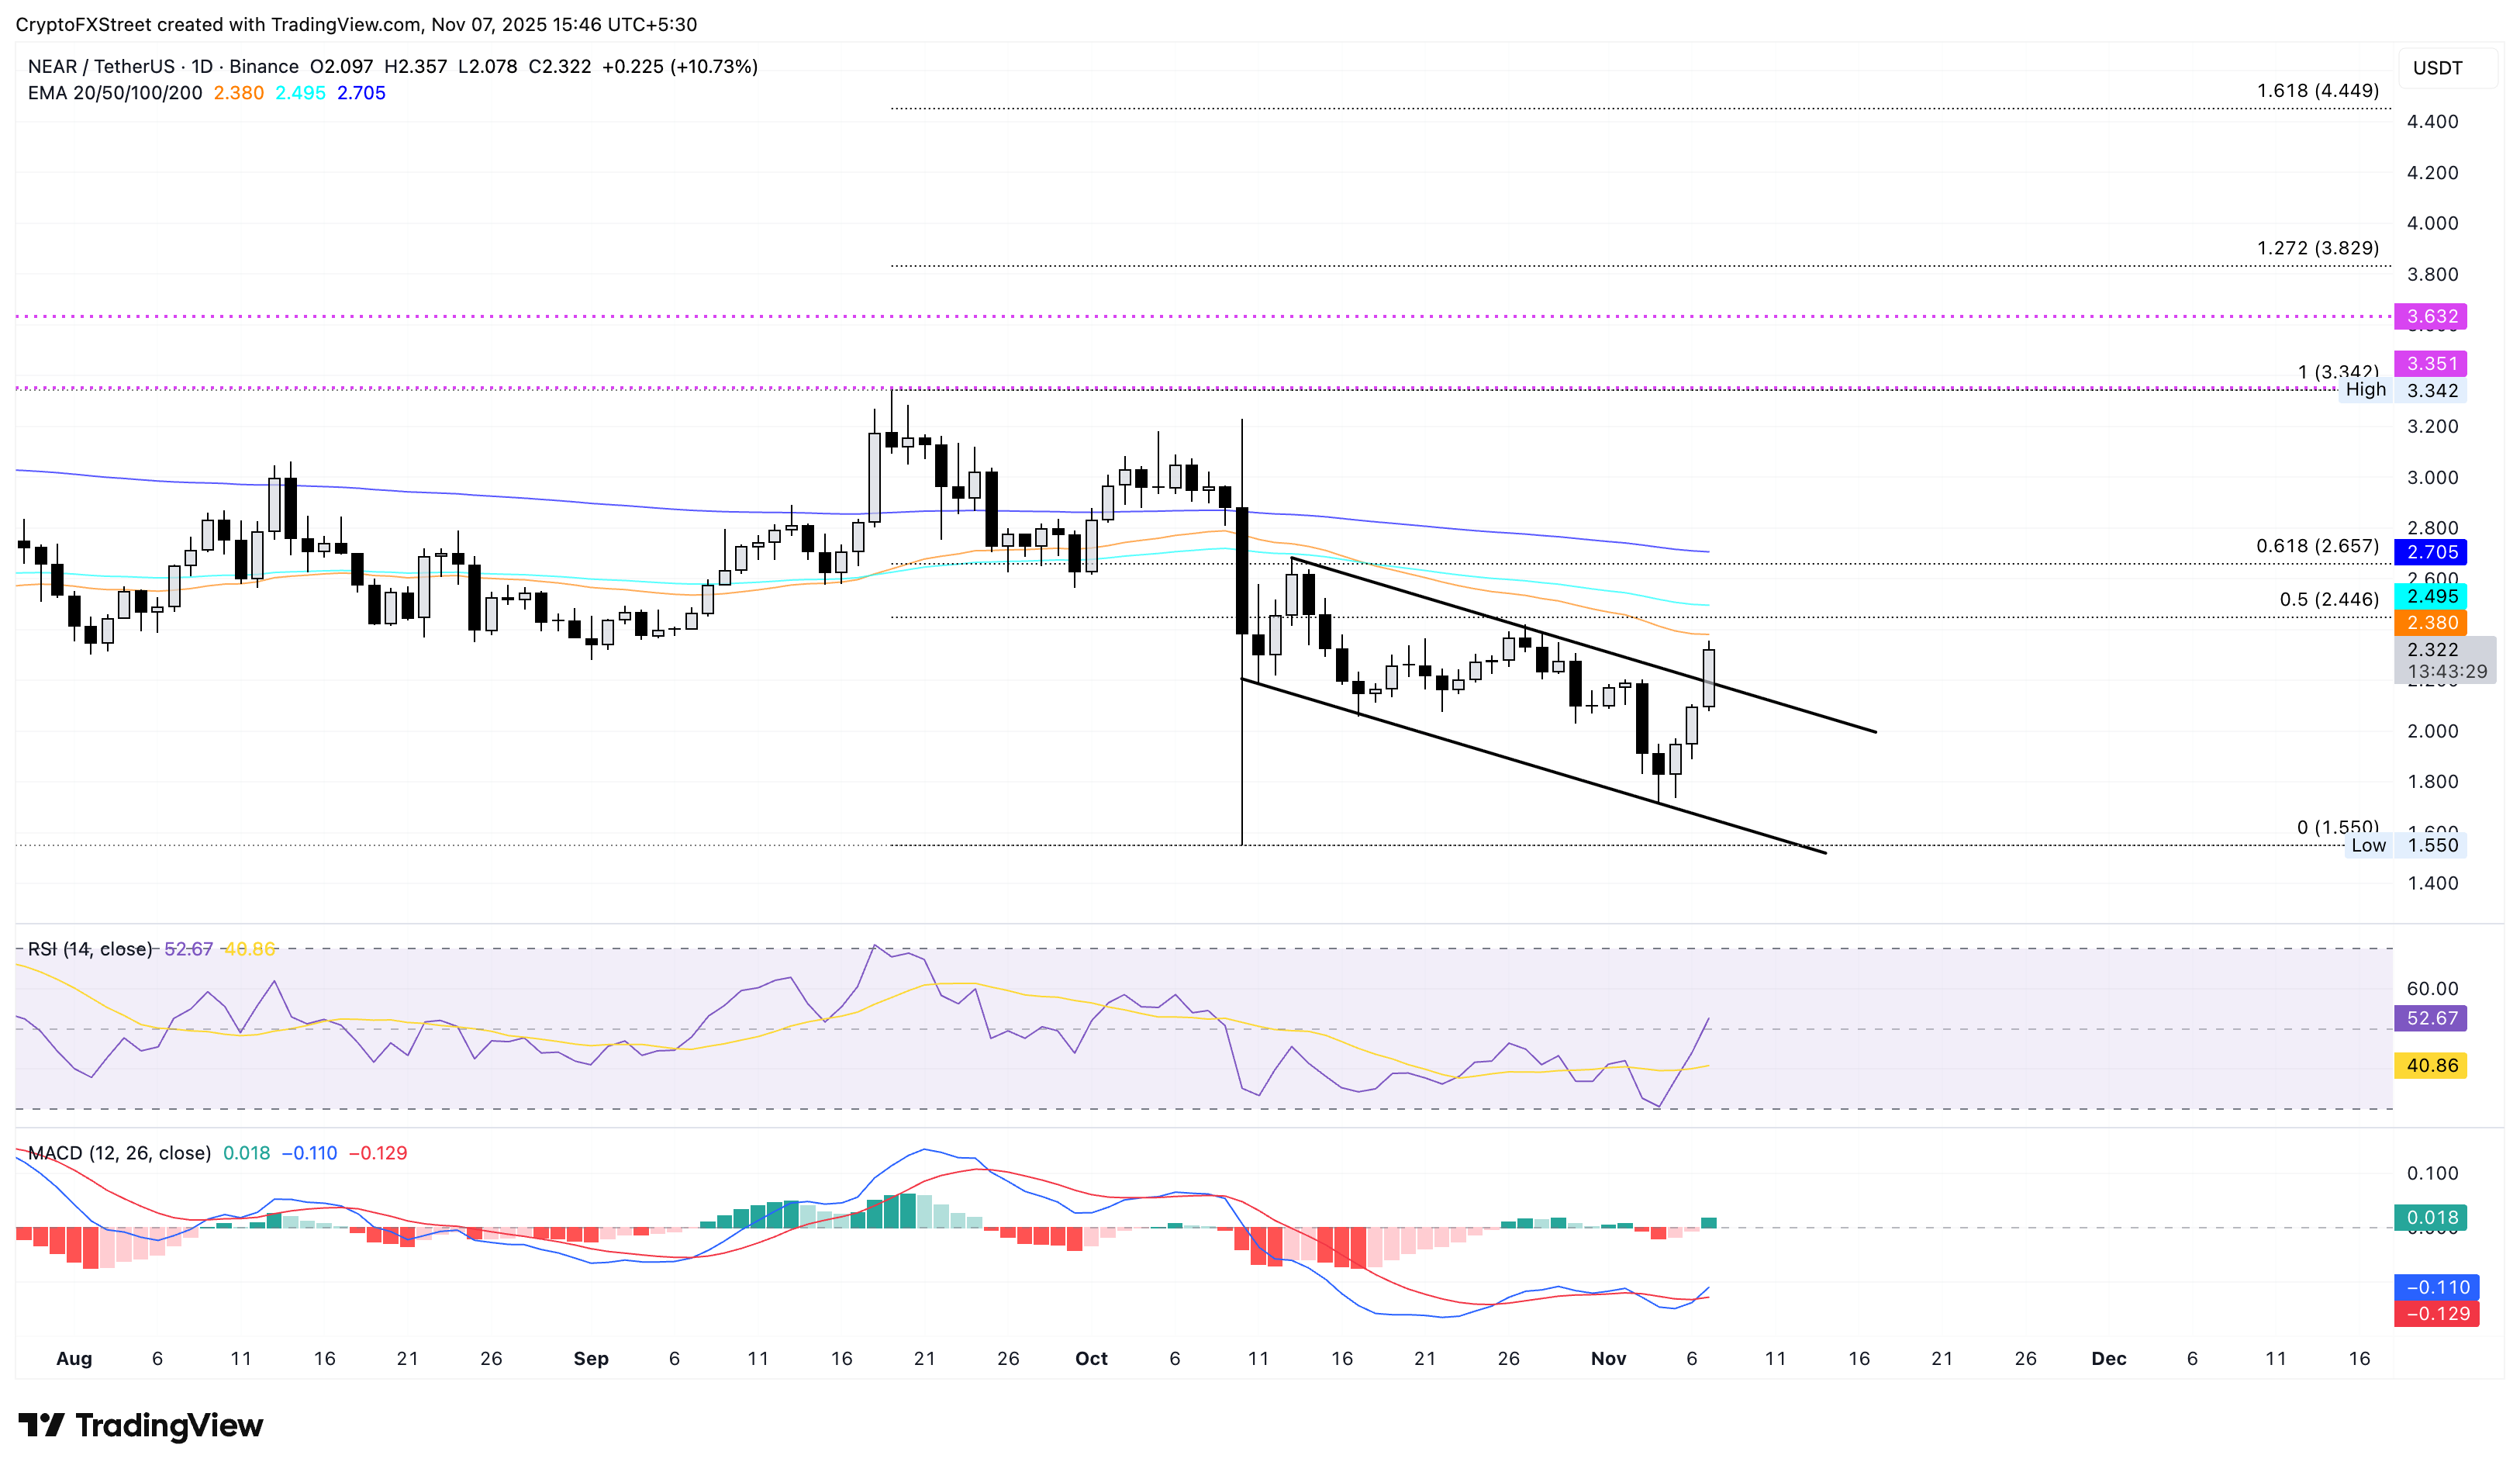
On the flip side, the $2.00 round figure remains a key psychological support. If NEAR slips below this level, it would invalidate the breakout rally.
Author

Vishal Dixit
FXStreet
Vishal Dixit holds a B.Sc. in Chemistry from Wilson College but found his true calling in the world of crypto.



