Monero technical analysis: XMR/USD fails to cross $100 after showing promise
- XMR/USD fell from $98.15 to $94.85 in the early hours of Saturday.
- The overall market sentiment looks bearish.

XMR/USD daily chart
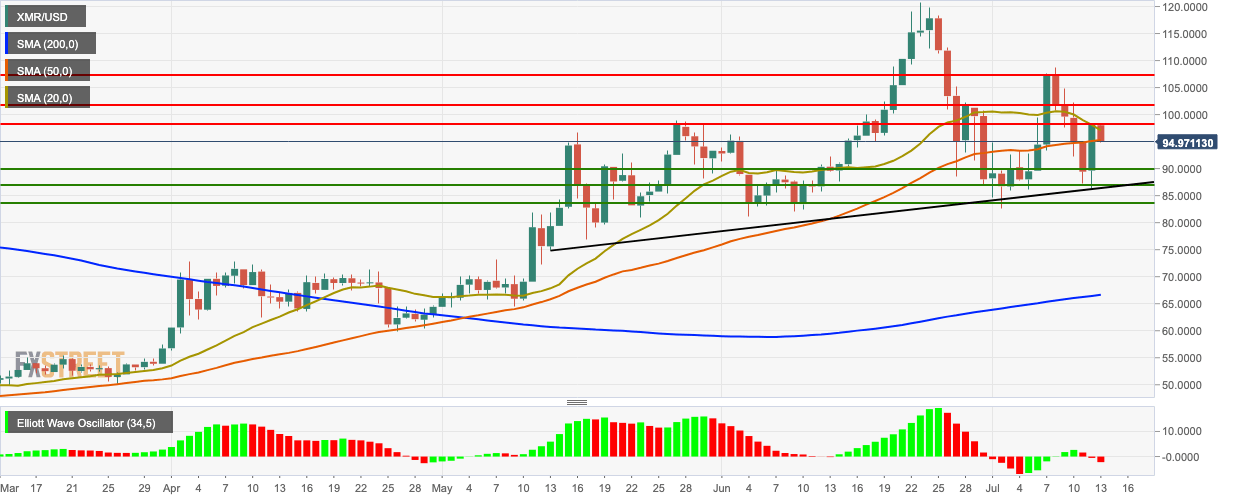
XMR/USD fell from $98.15 to $94.85 in the early hours of Saturday. This Friday, Monero bulls took charge and got the price up from $89.75 to $98.25. They were aiming to get back into the $100-zone, but they eventually lost steam. The 20-day simple moving average (SMA 20) curve acts as market resistance, while the SMA 50 curve acts as support. The daily price chart is comfortably trending above the SMA 200 curve. The Elliot oscillator shows three straight bearish sessions.
XMR/USD 4-hour chart
-636985902605907186.png)
The 4-hour price chart had a bullish breakout from the green Ichimoku cloud before it found resistance on the $98.25 line and fell back in. The latest price session went down from $98.25 to $95. The signal line has crossed over the moving average convergence/divergence (MACD) line showing increasing bullish momentum.
XMR/USD hourly chart
-636985902224689267.png)
The four latest sessions in the hourly price chart are trending in a downward channel formation. The price has found resistance on the $98-level and then fell sharply to $95. The latest session finds resistance on the SMA 200 curve and support on the SMA 20 curve. The 20-day Bollinger jaw has narrowed, showing decreasing market volatility. The relative strength index (RSI) indicator flirted a bit with the overbought zone and the dipped down into the neutral territory.
Key Levels
Author

Rajarshi Mitra
Independent Analyst
Rajarshi entered the blockchain space in 2016. He is a blockchain researcher who has worked for Blockgeeks and has done research work for several ICOs. He gets regularly invited to give talks on the blockchain technology and cryptocurrencies.


