Monero Price Forecast: XMR risks extending correction as market structure weakens
- Monero struggles below $500 amid mixed signals in the broader crypto market.
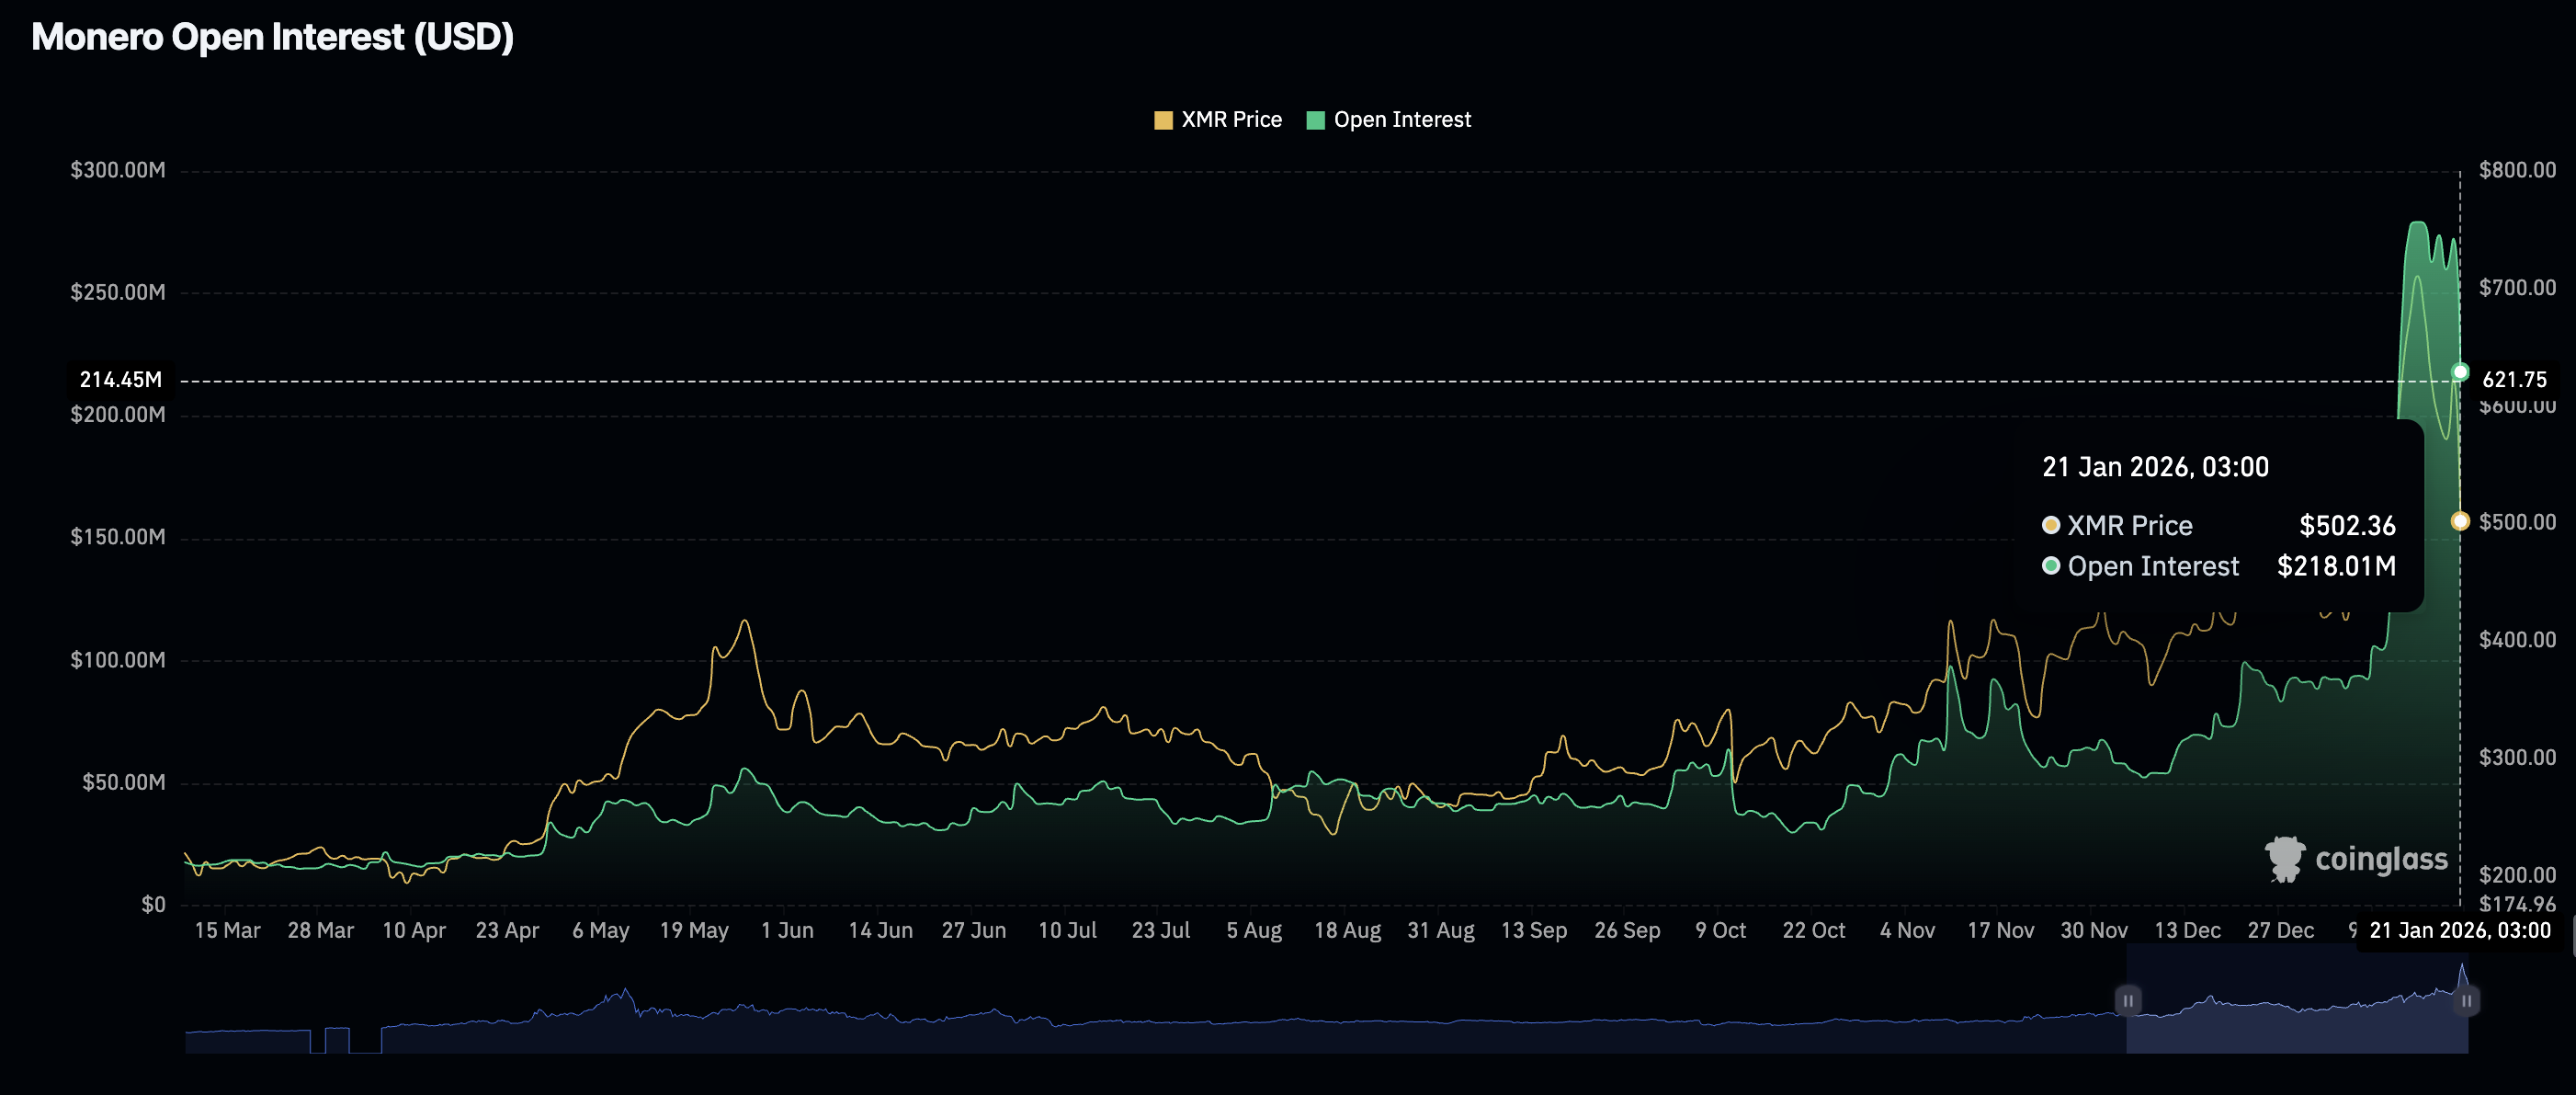
- Retail demand wanes with futures Open Interest dropping to $218 million on Wednesday.
- The MACD indicator's bearish crossover, along with the RSI slipping below its midline, increases Monero’s downside risks.

Monero (XMR) is extending its downtrend, below the $500 level at the time of writing on Wednesday, as sellers remain dominant during the American session. XMR has declined by approximately 38% from a recent high of $800, reached last Wednesday.
Monero’s price action reflects broader crypto market weakness in the last few days, as Bitcoin (BTC) dropped from $97,000 last week to around $89,000 on Wednesday. The leading altcoin by market capitalization, Ethereum (ETH), extended its decline below $3,000 but remains above $2,900.
With Monero testing critical support levels amid deteriorating technical indicators, low retail demand would be dominant. The privacy-focused token may face further downside pressure in the near term, challenging the bullish structure that characterized its earlier rally.
Monero faces reduced retail engagement
Retail demand for Monero has declined over the last week, with the derivatives market showing futures Open Interest (OI) at approximately $218 million on Wednesday.
OI represents the notional value of outstanding futures contracts, which stood roughly at $272 million on Tuesday. This sharp pullback hints at reduced user engagement, as traders go on the defensive to protect capital. A further decline would imply a lack of confidence in Monero’s ability to recover or sustain an uptrend.
Technical outlook: Monero slides as downside pressure mounts
Monero is struggling to reclaim $500, its immediate support level, but the overall outlook remains bearish. The Relative Strength Index (RSI) has extended its decline below the midline on the daily chart, emphasising the increasing sell-side pressure.
The Moving Average Convergence Divergence (MACD) indicator holds below its signal line, aligning with the broader bearish technical structure. Traders would be prompted to reduce risk exposure if the histogram continues to expand below the zero line.
Such action may push XMR to retest the 50-day Exponential Moving Average (EMA) at $484 and perhaps the 100-day EMA at $432.
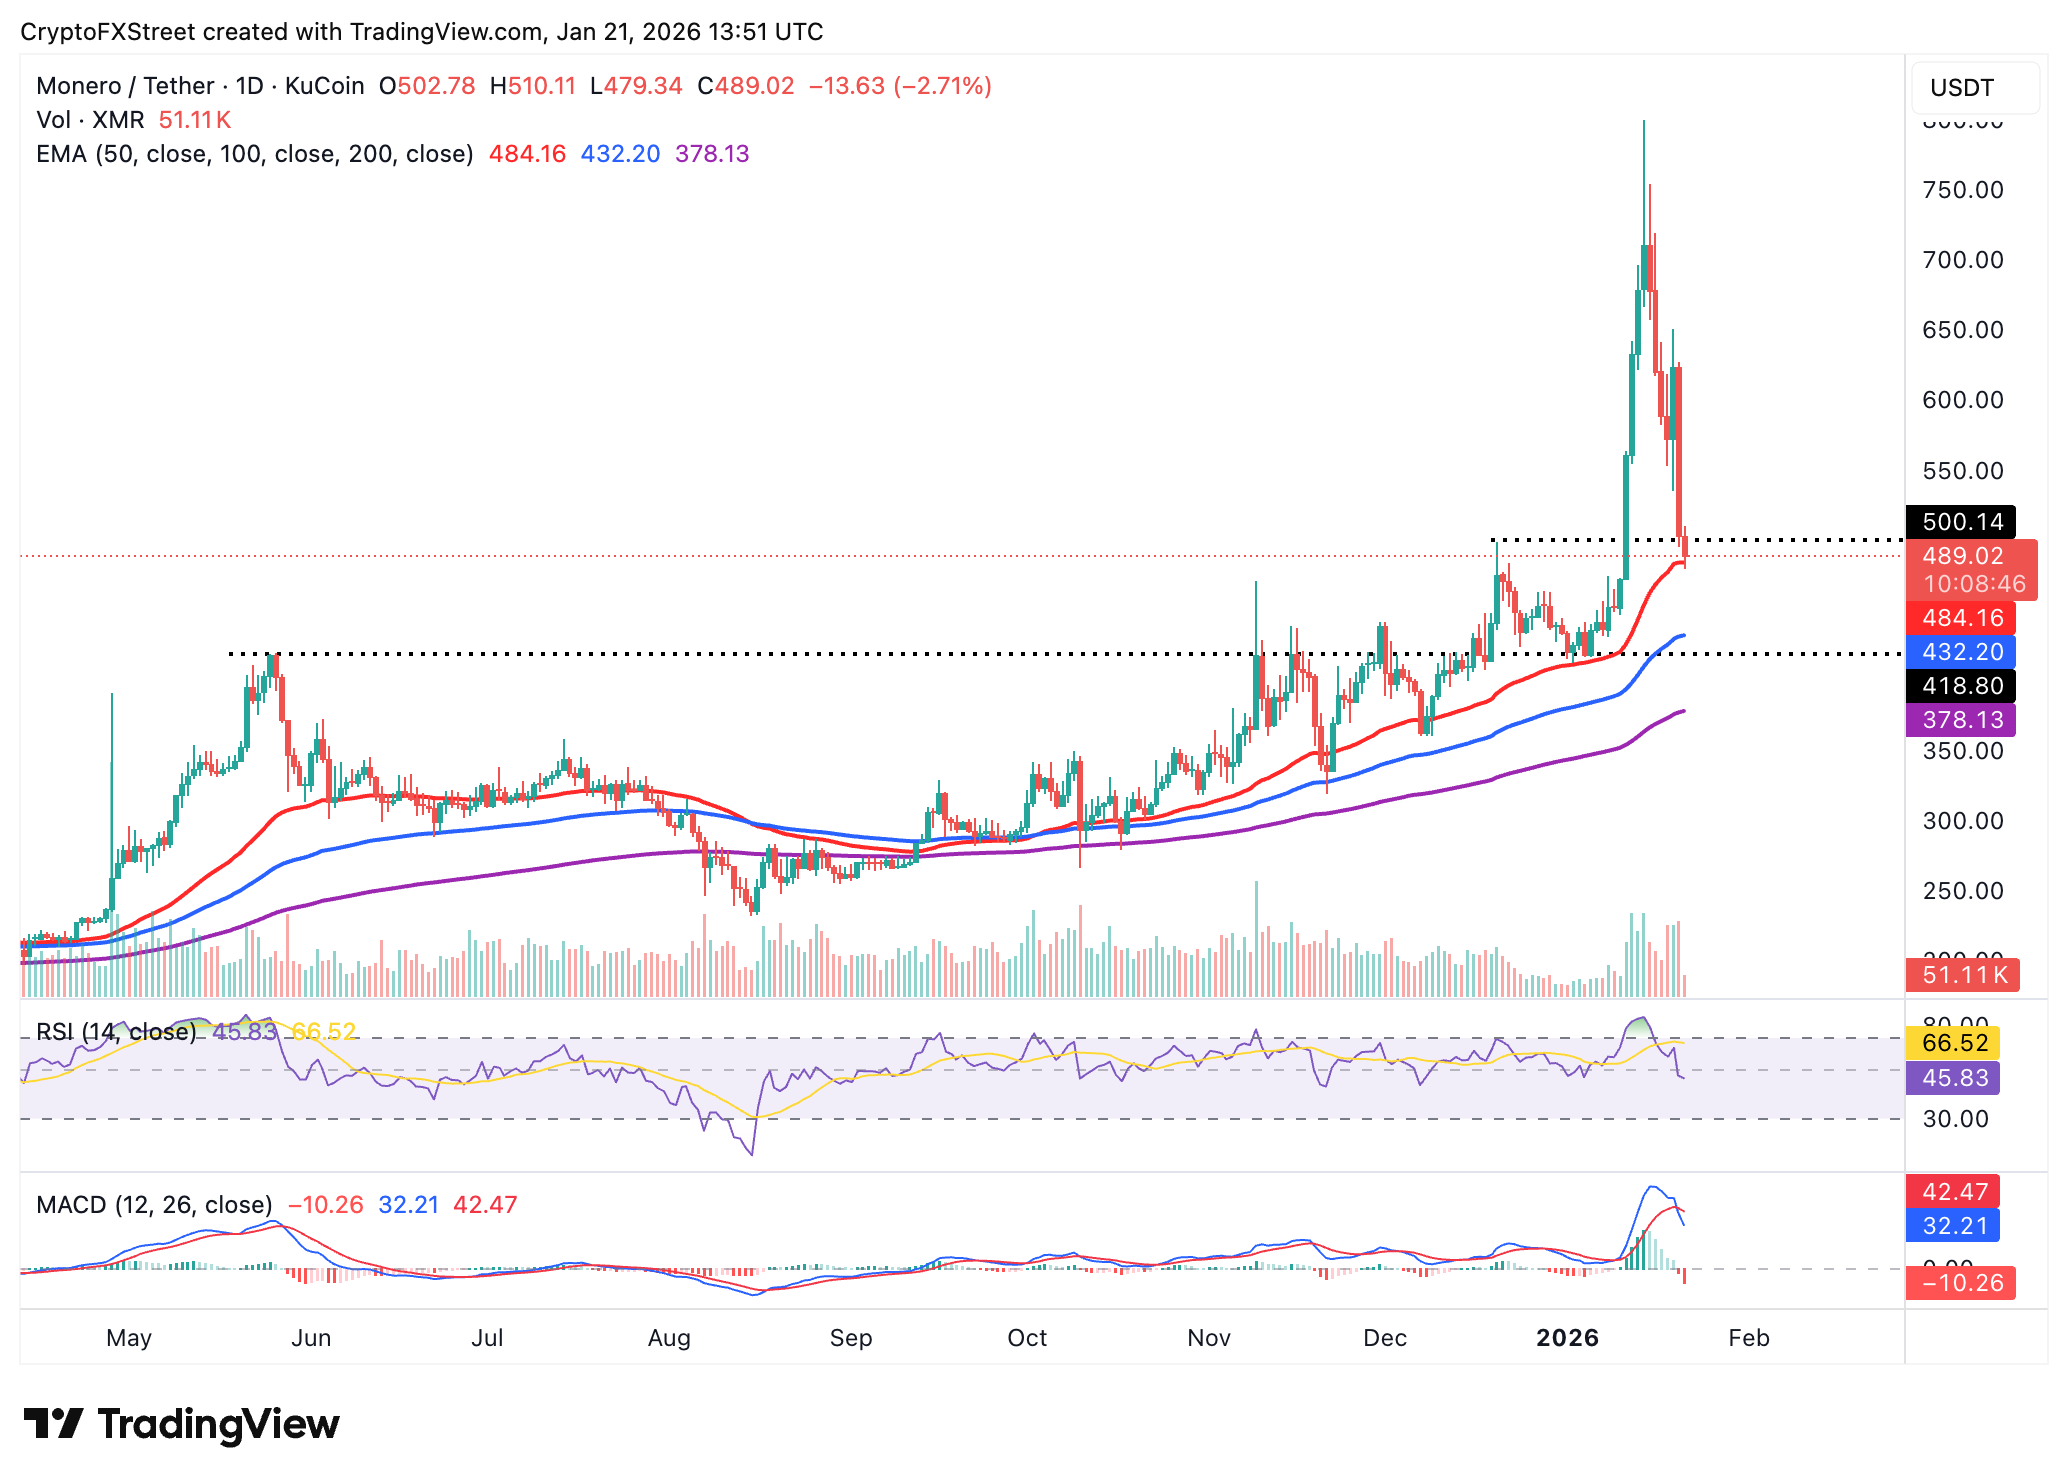
If Monero remains above the 50-day EMA, traders may gain confidence in its potential recovery above the $500 level. From here, key milestones include a break above resistance at $600 and $700 through to $800.
Open Interest, funding rate FAQs
Higher Open Interest is associated with higher liquidity and new capital inflow to the market. This is considered the equivalent of increase in efficiency and the ongoing trend continues. When Open Interest decreases, it is considered a sign of liquidation in the market, investors are leaving and the overall demand for an asset is on a decline, fueling a bearish sentiment among investors.
Funding fees bridge the difference between spot prices and prices of futures contracts of an asset by increasing liquidation risks faced by traders. A consistently high and positive funding rate implies there is a bullish sentiment among market participants and there is an expectation of a price hike. A consistently negative funding rate for an asset implies a bearish sentiment, indicating that traders expect the cryptocurrency’s price to fall and a bearish trend reversal is likely to occur.
Author

John Isige
FXStreet
John Isige is a seasoned cryptocurrency journalist and markets analyst committed to delivering high-quality, actionable insights tailored to traders, investors, and crypto enthusiasts. He enjoys deep dives into emerging Web3 tren


