Monero Price Analysis: XMR/USD bulls make a comeback after finding support on the SMA 20 curve
- XMR/USD bulls made a comeback following three straight bearish days.
- The Elliott Oscillator and MACD indicator show sustained bearish market sentiment.

XMR/USD daily chart
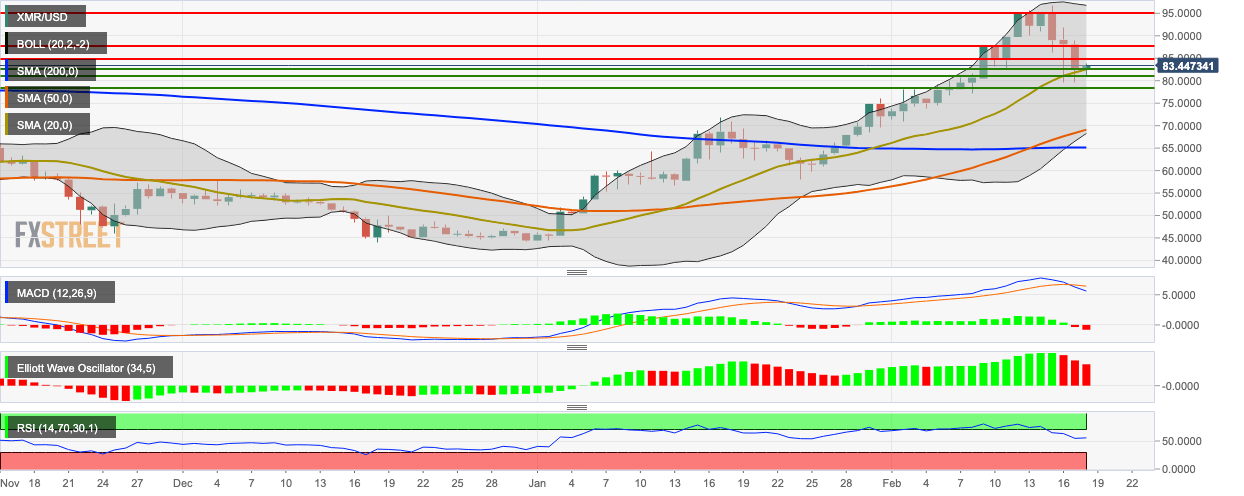
XMR/USD bulls jumped up from the support provided by the SMA 20 curve to rise from $82.68 to $83.13. Before this, the market suffered from three straight bearish days following its repeated failure to break above the $95 psychological level. During this time period, XMR/USD fell from $95 to $82.68. Both the Elliott Oscillator and MACD indicate that the bears still have complete control of the market. The RSI is crawling along the 56.40-level with bulls and bears canceling each other out.
Author

Rajarshi Mitra
Independent Analyst
Rajarshi entered the blockchain space in 2016. He is a blockchain researcher who has worked for Blockgeeks and has done research work for several ICOs. He gets regularly invited to give talks on the blockchain technology and cryptocurrencies.


