Memecoins on the move: WIF, BOME, and FLOKI post double-digit gains as US-China agree on tariff reduction
- Dogwifhat, Book of Meme, and FLOKI prices extend rallies by more than double-digit gains on Monday, adding to last week’s surge.
- The announcement that the US and China agreed to major tariff reductions on Monday fuels risk-on sentiment.
- The technical outlook of these memecoins suggests rally continuation, targeting further gains.

Dogwifhat (WIF), Book of Meme (BOME), and FLOKI (FLOKI) extend their double-digit rallies on Monday, adding to last week’s surge. The rally is driven by growing risk-on sentiment in crypto markets after the US and China agreed to major tariff reductions. From a technical perspective, all three meme coins have the potential for further upside.
US-China tariff reduction deal supports risk-on sentiment
On Monday, the US and China announced a 90-day tariff reduction agreement between the US and China, dropping US tariffs on Chinese goods from 145% to 30% and China's tariffs on US goods from 125% to 10%, Bloomberg reports.The agreement follows weekend talks between the two countries in Geneva, Switzerland, led by US Treasury Secretary Scott Bessent and US Trade Representative (USTR) Jamieson Greer from the US side and by Vice Premier He Lifeng from the Chinese side.
The easing of the tariff dispute between two major global economies sparked a risk-on sentiment in the crypto market, boosting investor confidence in riskier assets and fueling renewed interest in speculative cryptocurrencies like meme coins.
Dogwifhat bulls aim for higher leg
Dogwifhat price broke above its 100-day Exponential Moving Average (EMA) at $0.76 on Saturday and rallied 26%. It closed above its daily resistance level at $0.79 during the same period. At the time of writing on Monday, it continues to trade higher by 36% at around $1.24.
If WIF continues its upward trend, it could extend the rally to retest its weekly resistance at $1.44.
The Relative Strength Index (RSI) on the daily chart is well above its overbought level of 70, indicating extreme overbought conditions. However, traders should be cautious as the chances of a pullback are high due to the overbought condition. Another possibility is that the RSI remains above the overbought level of 70 and continues its upward trend.
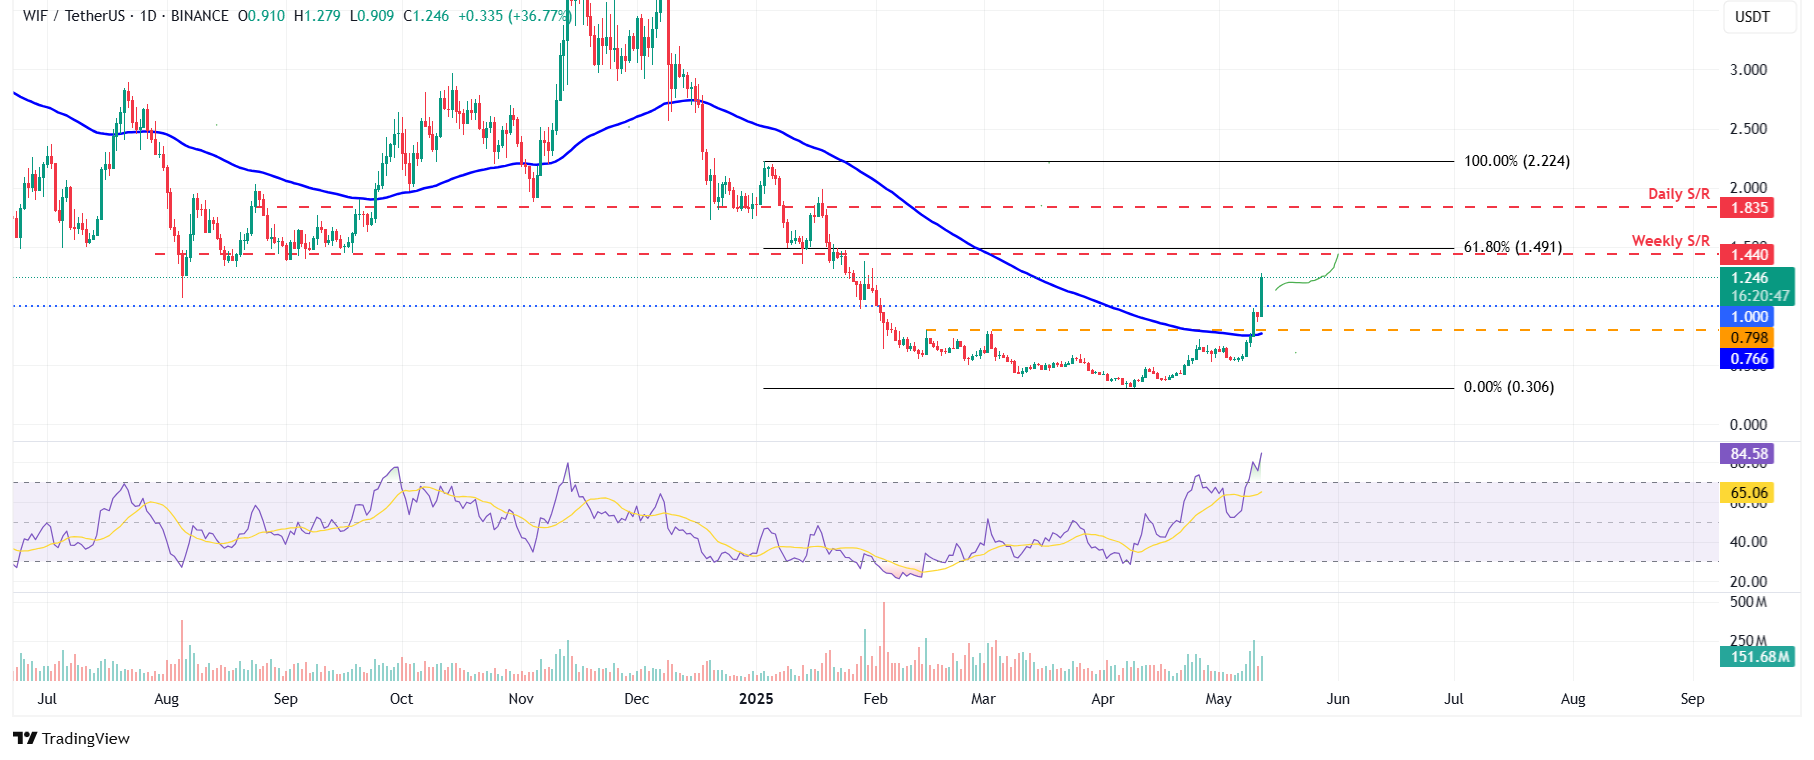
WIF/USDT daily chart
However, if WIF faces a pullback, it could retest its key psychologically important level at $1.00.
Book of Meme shows potential for additional gains
Book of Meme price closed above its daily resistance level at $0.0016 on Friday and rallied 34% until the next day to retest its 100-day EMA at $0.0022. At the time of writing on Monday, it broke above its 100-day EMA level and trade higher around $0.0026.
If BOME continues its upward momentum, it could extend the rally toward its January 31 high of $0.0036.
The RSI on the daily chart is above its overbought level of 70 and pointing up, indicating strong bullish momentum. However, traders should be cautious as the chances of a pullback are high due to the overbought condition. Another possibility is that the RSI remains above the overbought level of 70 and continues its upward trend.
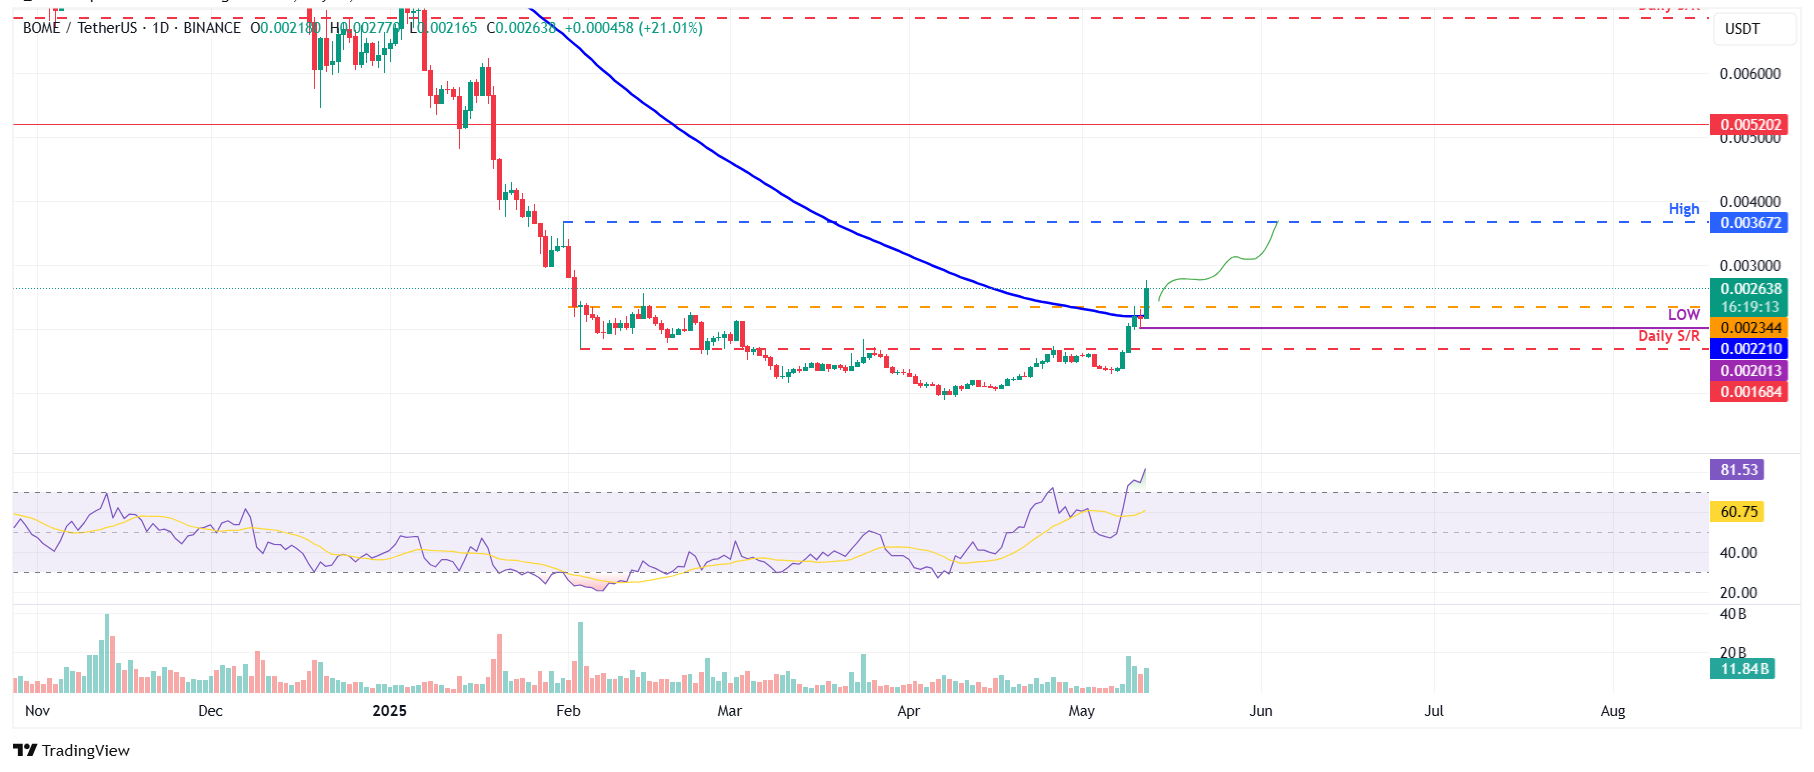
BOME/USDT daily chart
On the other hand, if BOME faces a correction, it could extend the decline to retest its Sunday low of $0.0020.
FLOKI bulls aim for the $0.00015 mark
FLOKI price broke above the descending trendline (drawn by joining multiple high levels since mid-December) on Thursday and rallied 44% over the next two days. At the time of writing on Monday, it continues to trade higher by 12%, breaking above its 200-day EMA at $0.00011.
If FLOKI closes above its 200-day EMA at $0.00011 on a daily basis, it could extend the rally to retest its next daily resistance at $0.00015.
The RSI on the daily chart rebounds from its overbought level of 70 on Monday, indicating strong bullish momentum. However, traders should be cautious as the chances of a pullback are high due to the overbought condition. Another possibility is that the RSI remains above the overbought level of 70 and continues its upward trend.
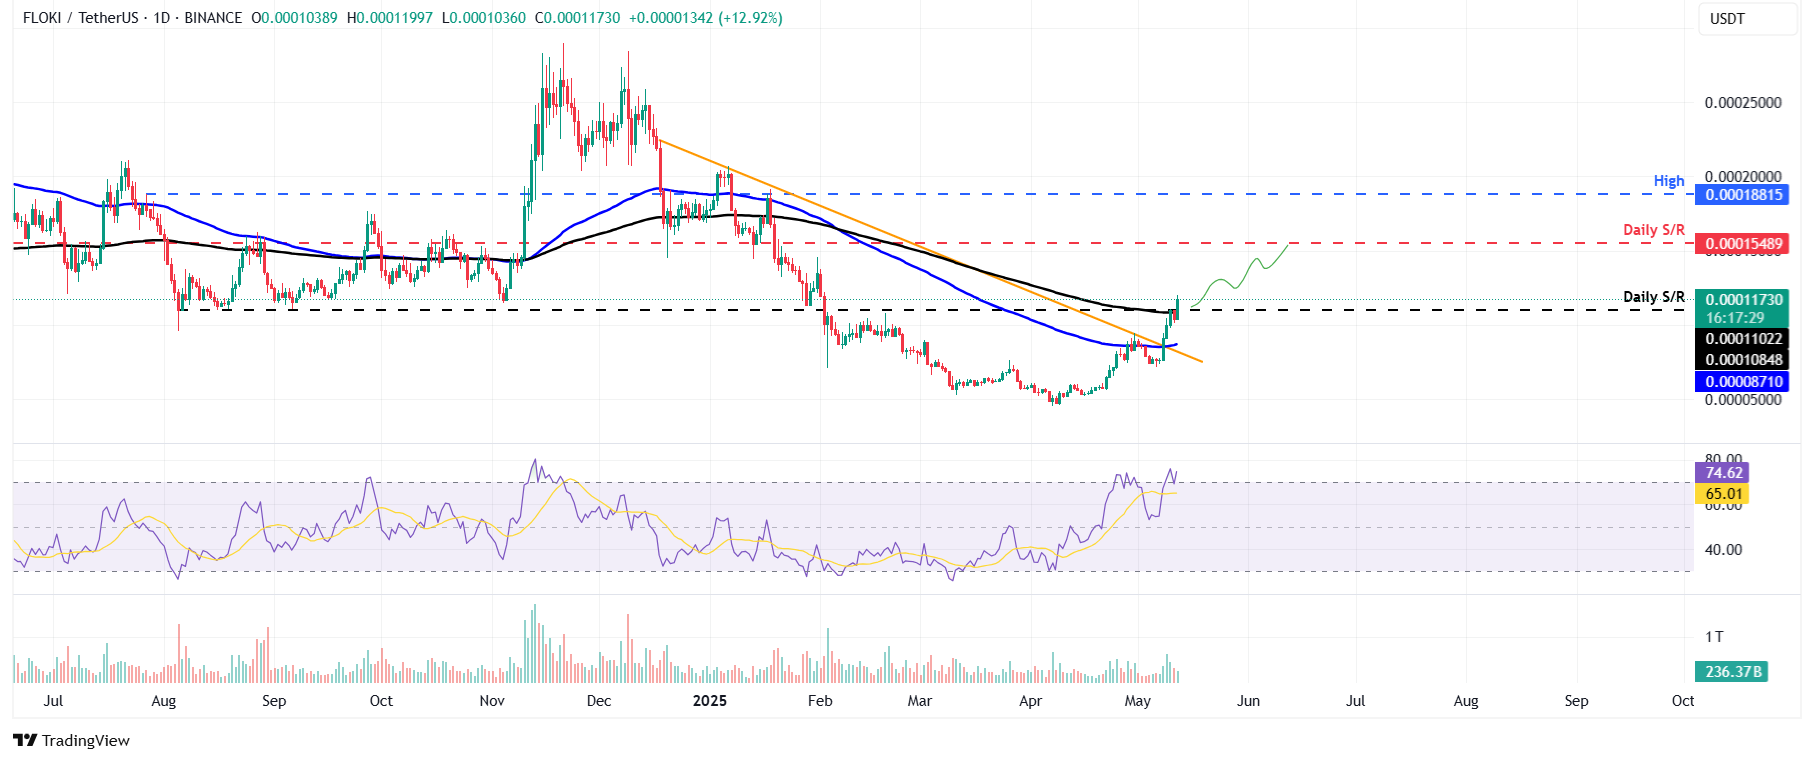
FLOKI/USDT daily chart
However, if FLOKI fails to close above $0.00011 and faces a pullback, it could extend the decline to retest its 100-day EMA at $0.00008.
Author

Manish Chhetri
FXStreet
Manish Chhetri is a crypto specialist with over four years of experience in the cryptocurrency industry.


