PEPE Price Forecast: PEPE bulls gain traction as Open Interest reaches a new all-time high
- Pepe price extends its gains on Monday after rallying nearly 70% in the previous week.
- CoinGlass data shows that PEPE’s Open Interest reaches a new all-time high on Monday.
- The technical outlook suggests a rally continuation, targeting the $0.000016 level.

Pepe (PEPE) price is extending its gains by 5% at the time of writing on Monday after rallying nearly 70% in the previous week. CoinGlass data shows that PEPE’s open interest reached a new all-time high of $595.36 on Monday, indicating new buying activity among traders. The technical outlook for the frog-themed meme coin suggests a rally continuation, targeting the $0.000016 level.
Pepe’s Open Interest reaches a new all-time high
Coinglass’ data shows that the futures’ OI in PEPE at exchanges rose from $398 million on Thursday to $595.36 million on Monday, a new all-time high. An increasing OI represents new or additional money entering the market and new buying, which could fuel the current PEPE price rally.
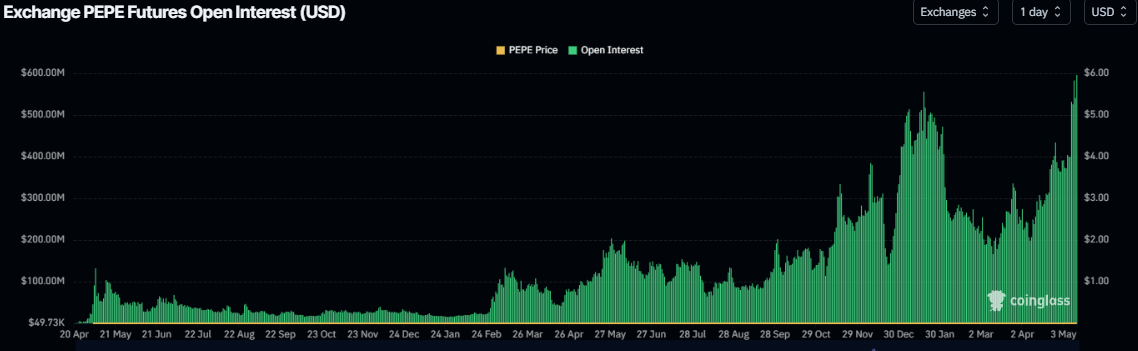
PEPE open interest chart. Source: Coinglass
Another bullish sign is Coinglass’s Pepe long-to-short ratio, which reads 1.09, the highest level in over a month. This ratio above one reflects bullish sentiment in the markets as more traders are betting on the rise of the frog-themed meme coin price.
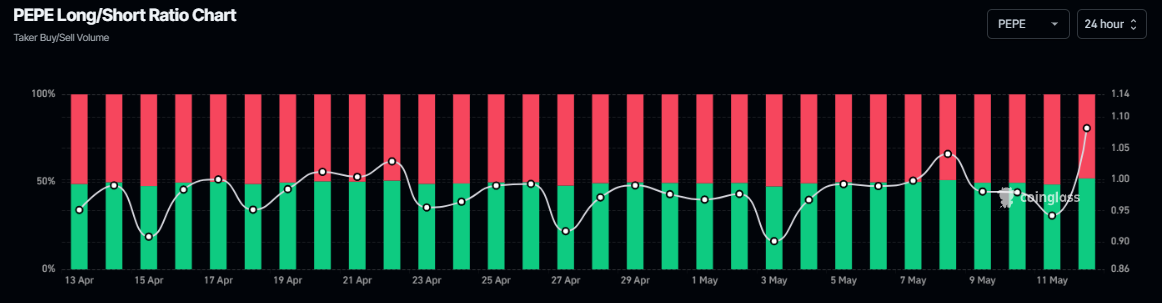
PEPE long-to-short ratio chart. Source: Coinglass
Pepe Price Forecast: Pepe bulls aim for the $0.000016 mark
Pepe price broke and closed above its 100-day Exponential Moving Average (EMA) at $0.000009 on Thursday and rallied over 64% until Saturday and closed above its daily resistance level at $0.000013. However, it faced a pullback the next day, and support was found at this daily level. At the time of writing on Monday, it continues to trade higher by 5% at around $0.000014.
If PEPE continues its upward trend, it could extend the rally to retest its next daily resistance at $0.000016. A successful close above this level will extend an additional gain toward its January 18 high of $0.000021.
The daily chart's Relative Strength Index (RSI) moves above 70, indicating strong bullish momentum. However, traders should be cautious as the chances of a pullback are high due to the overbought condition. Another possibility is that the RSI remains above the overbought level of 70 and continues its upward trend.
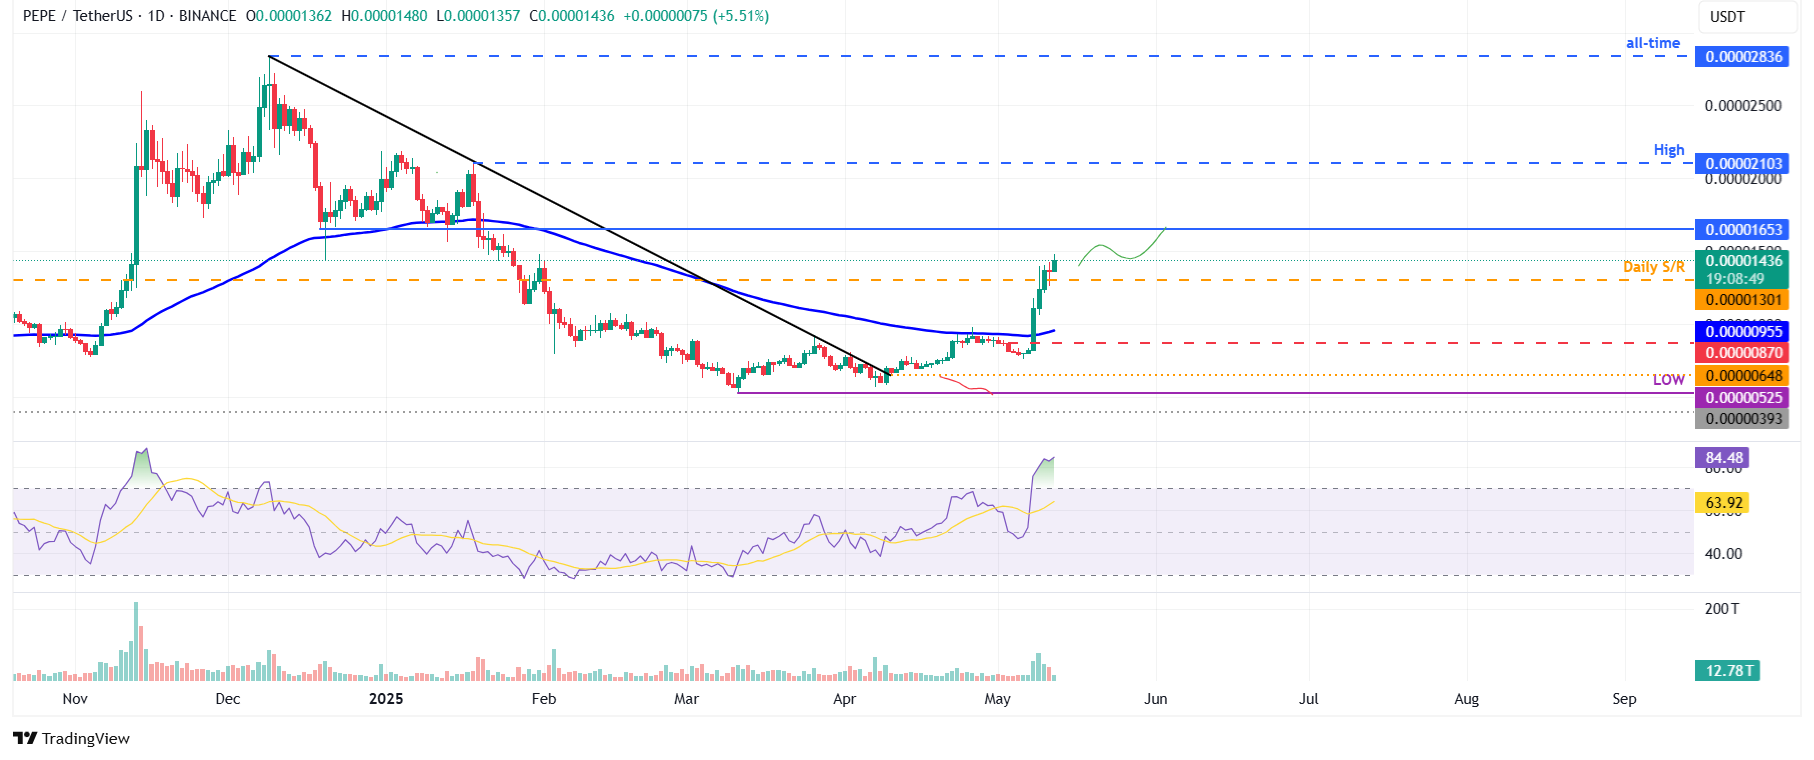
PEPE/USDT daily chart
However, if PEPE faces a pullback, it could extend the decline to retest its next support level at $0.000013.
Author

Manish Chhetri
FXStreet
Manish Chhetri is a crypto specialist with over four years of experience in the cryptocurrency industry.


