MATIC price to shock bears with a violent spike to $1.40
- MATIC price hit new five-month lows.
- After Monday's sell-off, buyers have poured in, regaining nearly all of the losses.
- Aggressive buying opportunities are now present.

MATIC price has jumped a considerable amount today, a somewhat unexpected occurrence. Monday’s price action resulted in the greatest daily sell-off since May 19, 2021 - nearly one year ago.
MATIC price readies for a strong bullish reversal
MATIC price has hit several time cycle-based milestones, indicating an end to the current downtrend. From an Ichimoku perspective, MATIC has hit new multi-month lows right on the date of a Kumo Twist. Kumo Twists occur when Senkou Span A crosses Senkou Span B - observed visually by the Cloud changing color from red to green or vice versa.
Kumo Twists can often identify where major, and minor swings highs/lows may develop. There is a high probability of new swing highs/lows generating on the date of a Kumo Twist if an instrument is trending into that date.
MATIC price action has completed two powerful time cycles from a Gann analysis perspective. The first is the 135-day Cycle of the Inner Year, which, wrote Gann is often the last low, ending a bottoming pattern, and always worth watching for a change in trend. He also indicated that fast moves usually start from this cycle.
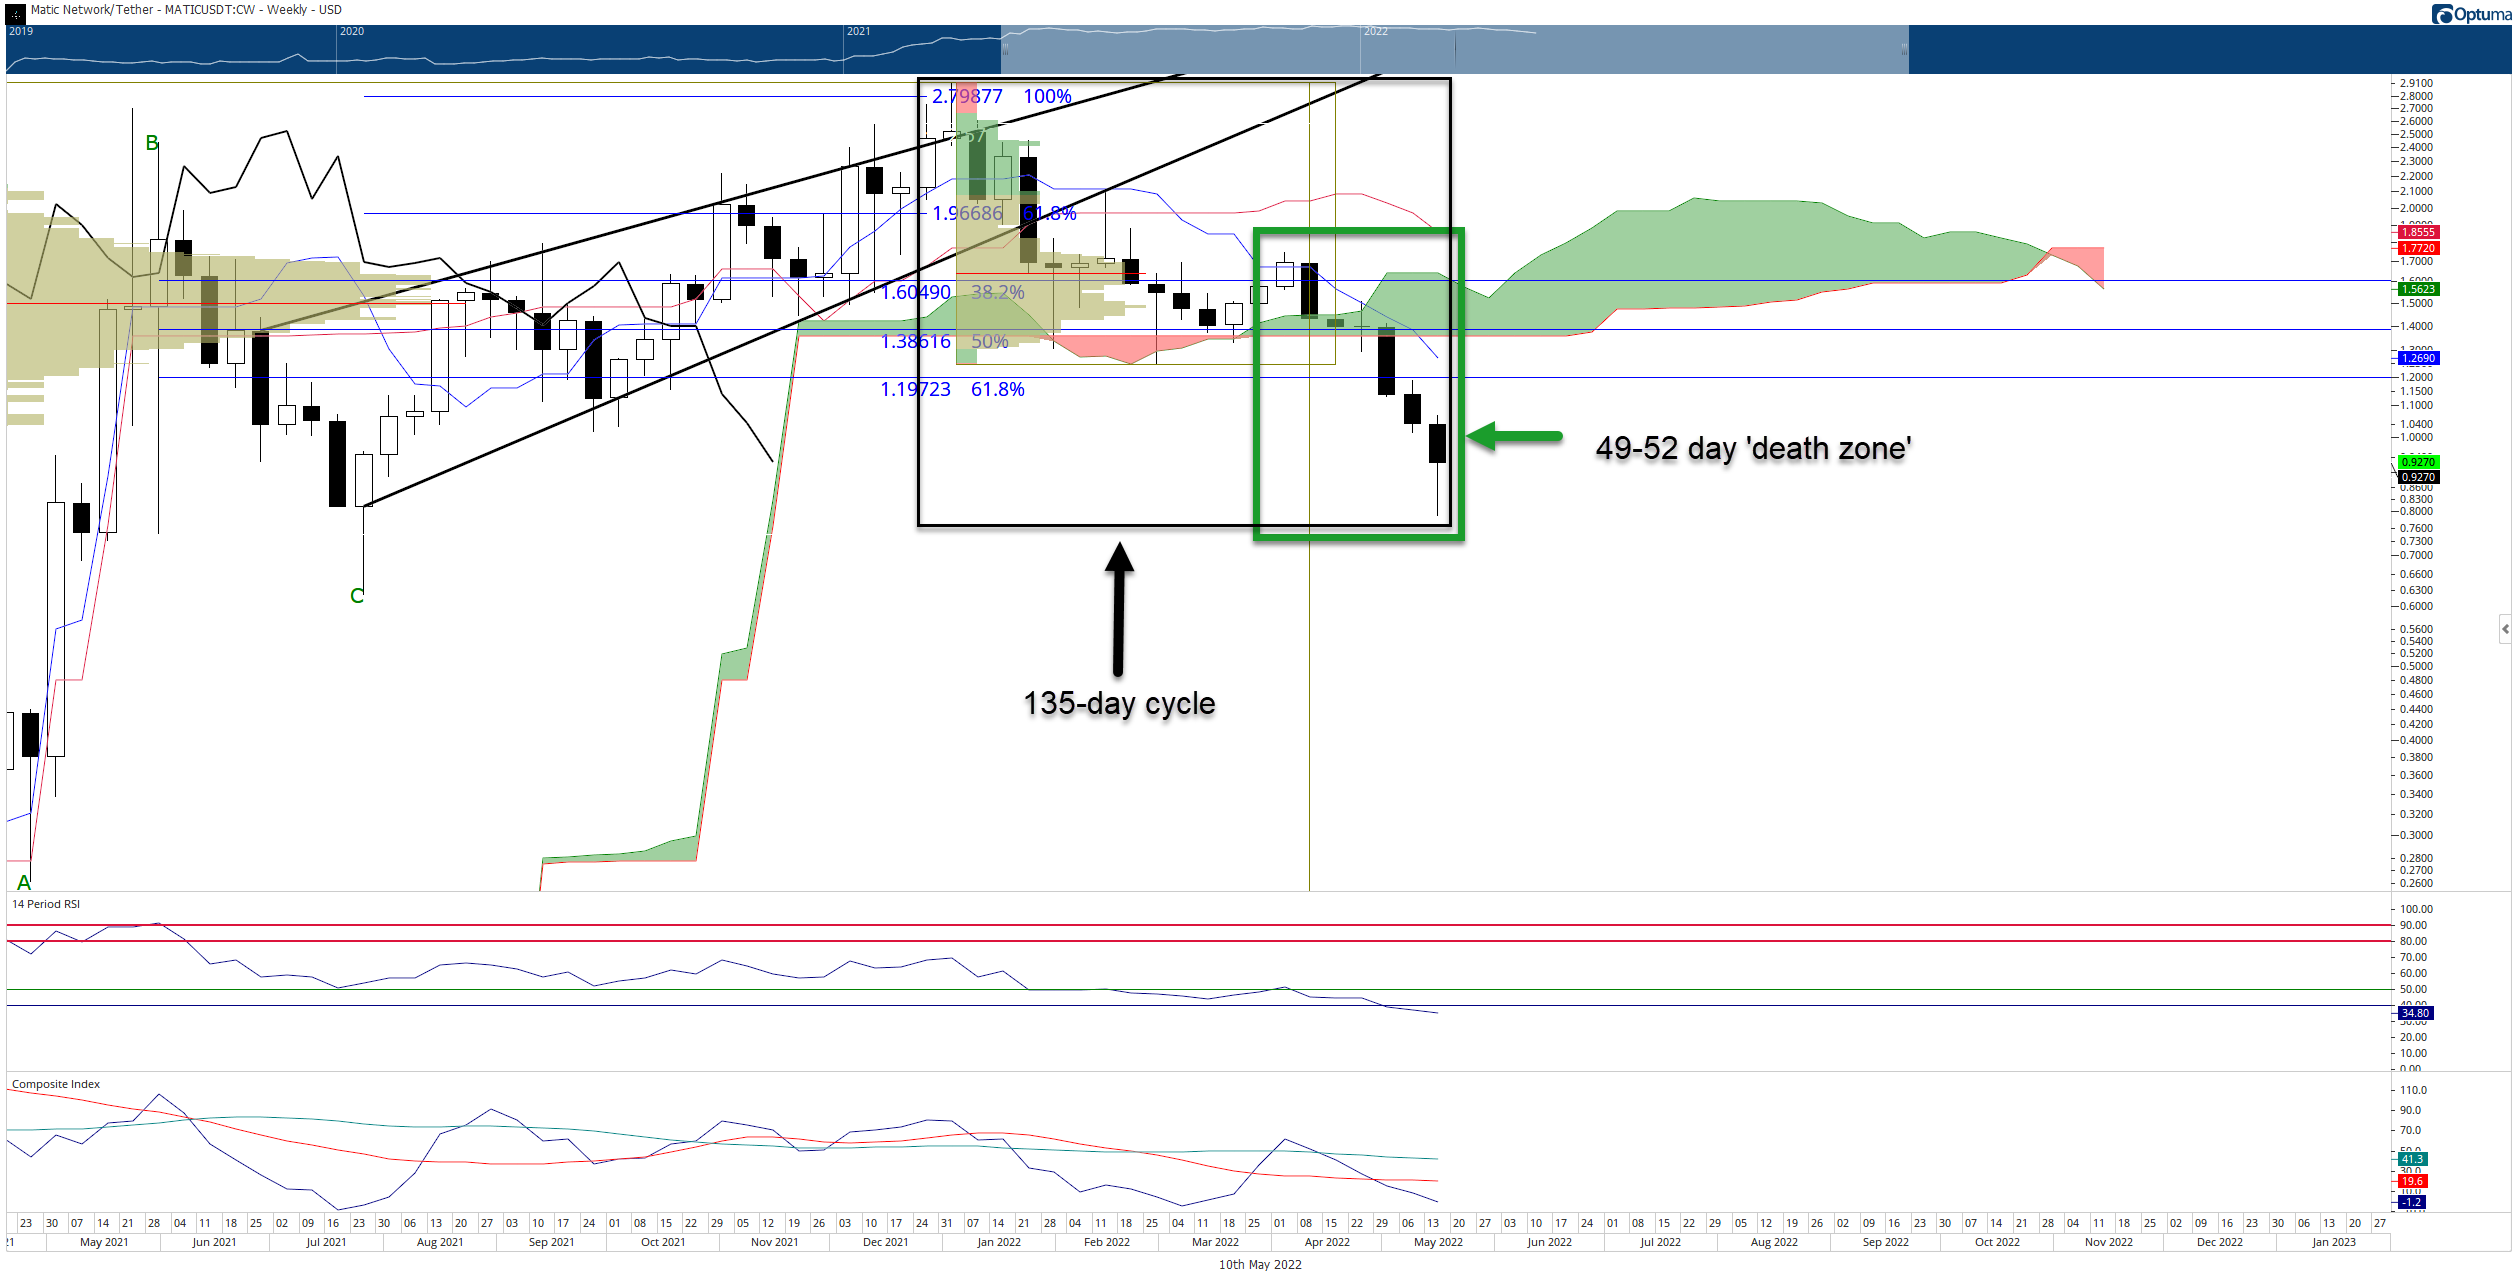
MATIC/USDT Weekly Ichimoku Kinko Hyo Chart
The second and most important of the Gann cycles that MATIC price completed is the 49-day to 52-day cycle, Gann called the ‘death zone.’ The ‘death zone’ cycle has a high probability of terminating what Gann called ‘blow-off moves’ - omnidirectional moves over seven weeks.
Complimenting the outlook for a bullish reversal is the current setup on the $0.05/3-box reversal Point and Figure chart in the form of a Spike Pattern. The Spike Pattern in Point and Figure is a column with fifteen or more Xs or Os. It is considered a move that has hit an extreme and is due for a strong corrective move that can often convert into a broader trend change.
The hypothetical long opportunity for MATIC price is a buy stop order at $1.00, a stop loss at $0.85, and a profit target at $1.45. A two-box trailing stop would help protect against any implied profit made post entry. The profit target is based on an exit upon hitting the bottom of the weekly Ichimoku Cloud (Senkou Span B) at $1.45 - a level where bears are likely to defend.
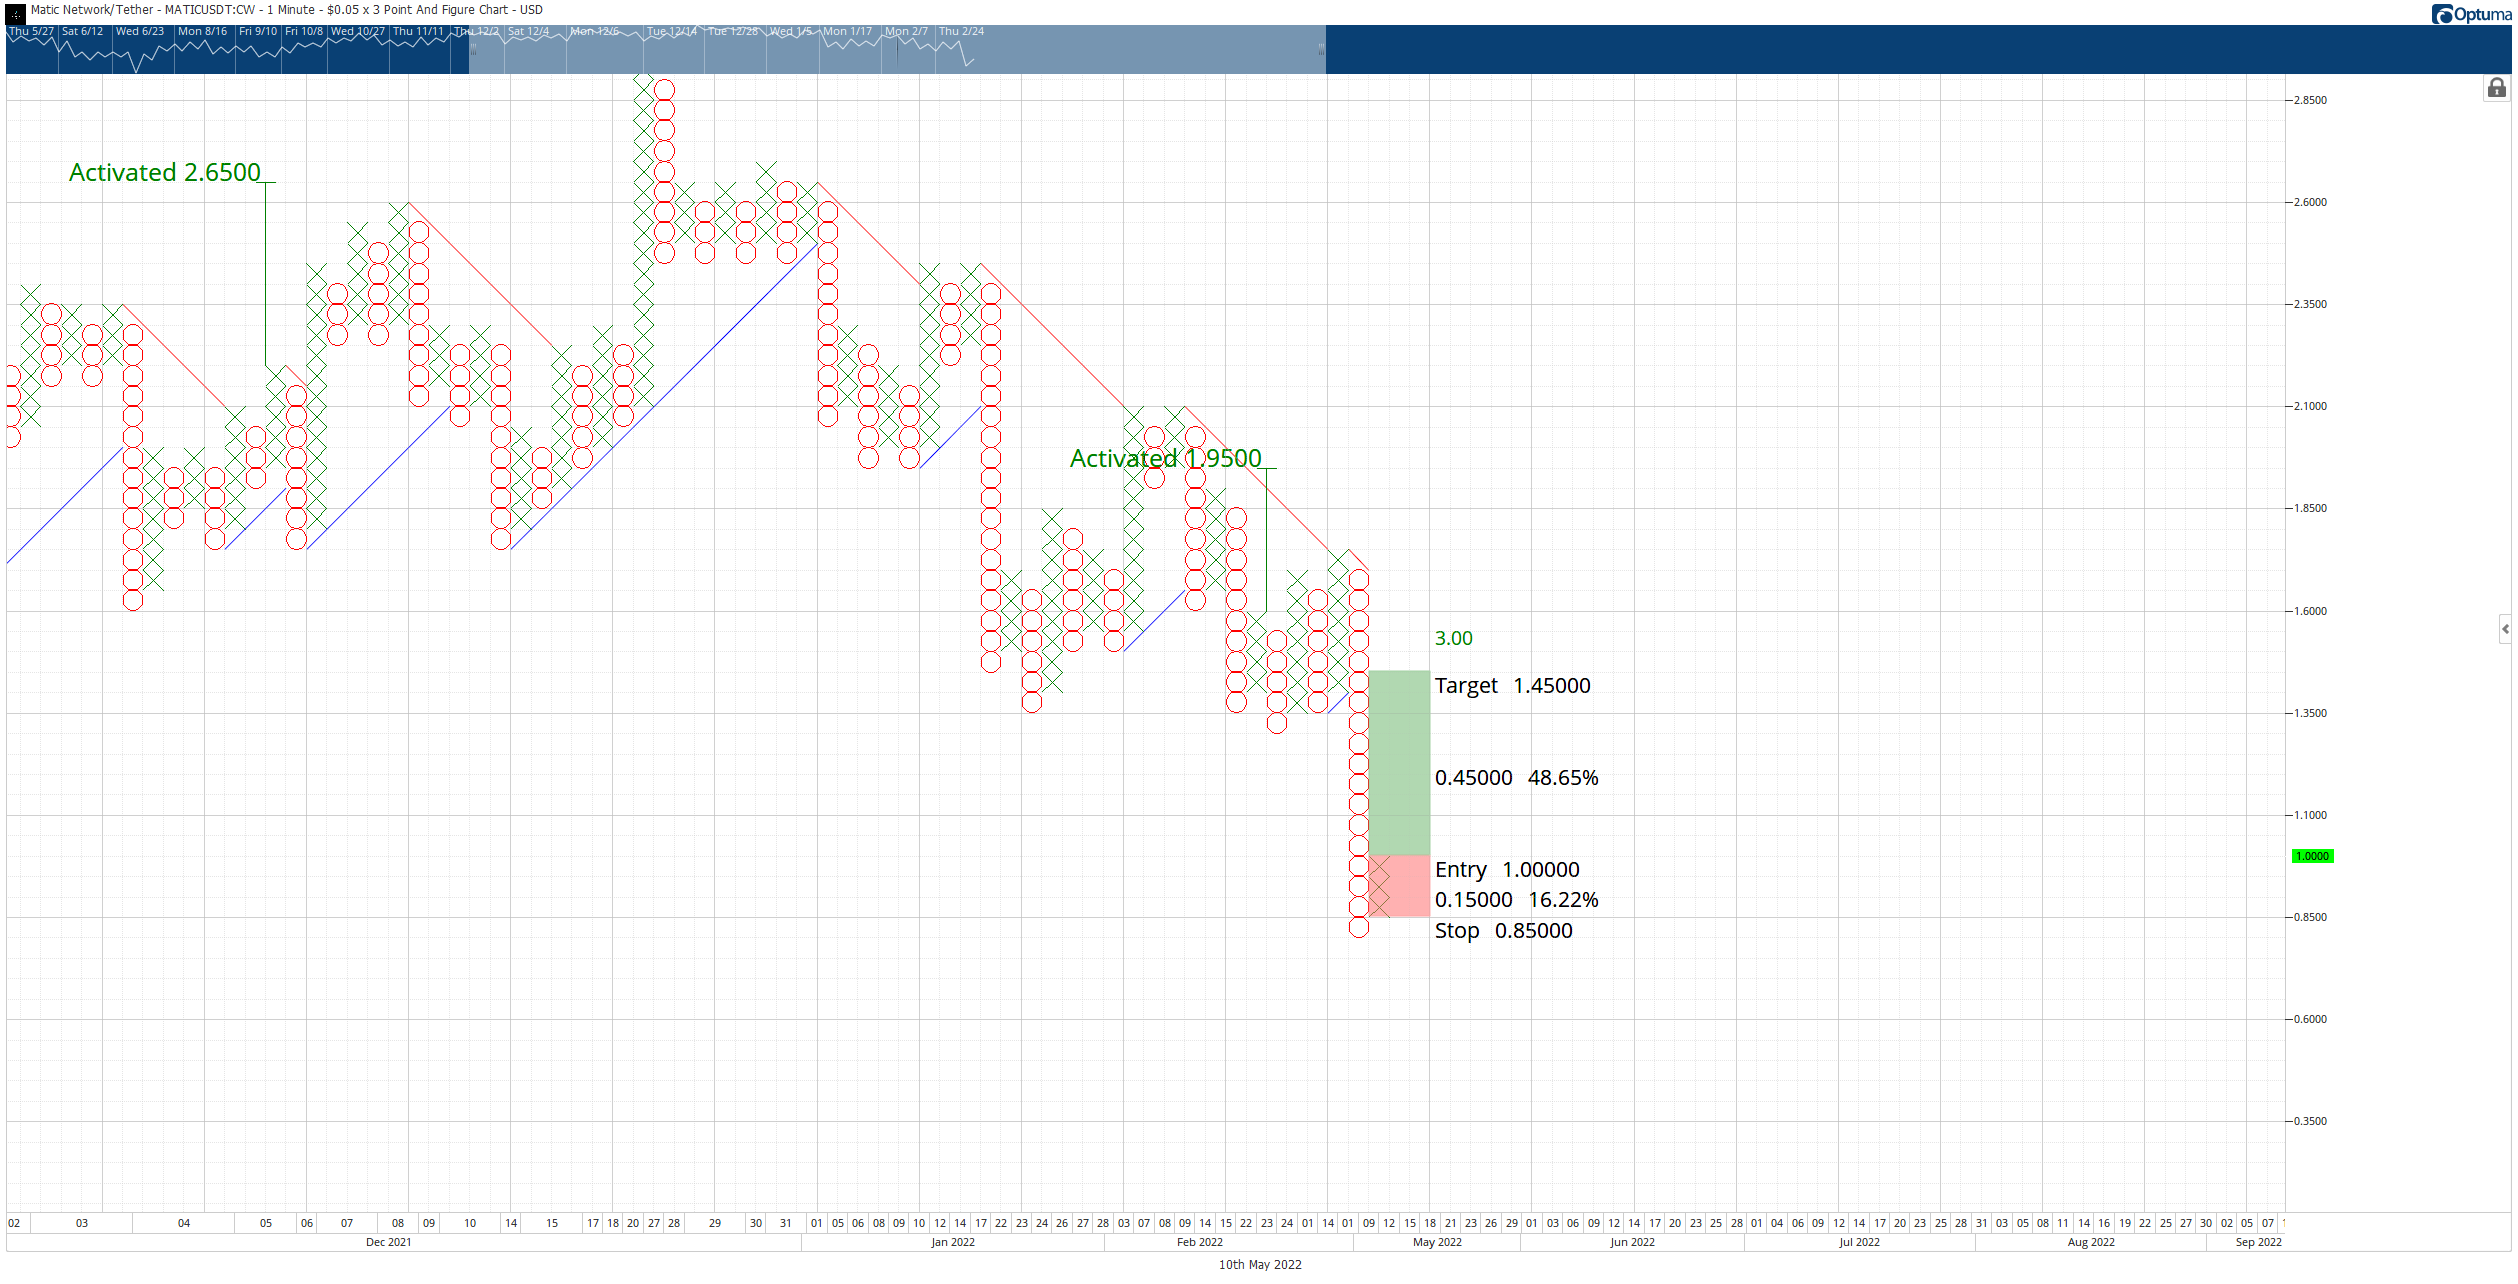
MATIC/USDT $0.05/3-box Reversal Point and Figure Chart
The long entry is invalidated if MATIC price drops to $0.75 before the entry is triggered.
Author

Jonathan Morgan
Independent Analyst
Jonathan has been working as an Independent future, forex, and cryptocurrency trader and analyst for 8 years. He also has been writing for the past 5 years.


