MATIC Price Prediction: Polygon to consolidate after striking key level
- MATIC price reaches significant Fibonacci extension as it rallies above topside trend line.
- Polygon closed yesterday with a two-day gain of over 50% based on closing prices.
- MATIC price may close today with a doji candlestick pattern, signaling investor indecision.

MATIC price overcame two days of indecision on May 12 and May 13 to generate one of the largest one-day advances in 2021. As long as Polygon remains above the topside trend line currently at $1.26, the DeFi token will extend the impulsive rally moving forward.
MATIC price marks a bullish tone in a market clouded with indecision
The two doji candlesticks on May 12 and May 13 reflected a level of equilibrium between Polygon buyers and sellers, and a heightened level of uncertainty. One of the reasons behind the indecision was the volatility in the cryptocurrency market and the downward pressure being exerted by the topside trend line running through the April 30 high.
MATIC price has now realized a 325% gain since the breakout from the multi-week consolidation on April 26. The performance has placed Polygon in one of the top spots on the leaderboard over that period and confirms the accelerating interest in the ecosystem’s scalability initiatives.
Over the last three days, MATIC has sliced through the 261.8% Fibonacci extension of the March-April consolidation at $1.53. Yesterday, it came within $0.01 of tagging the 261.8% extension of the recent May consolidation at $1.99. Overall, it represents a gain of over 90% from the cup base breakout on May 9 at $1.02.
If Polygon investors conquer the notable resistance around $2.00, the next upside target for MATIC price is the 361.8% extension of the May consolidation at $3.01, yielding a 50% gain from yesterday’s high at $1.98.
Aligned with the bullish Polygon outlook is the muted overbought condition shown on the daily Relative Strength Index (RSI), which may dictate higher prices in the near term. However, it is essential to note that the weekly RSI shows the highest overbought reading since trading began and could undermine the rally to $3.00 in the near term.
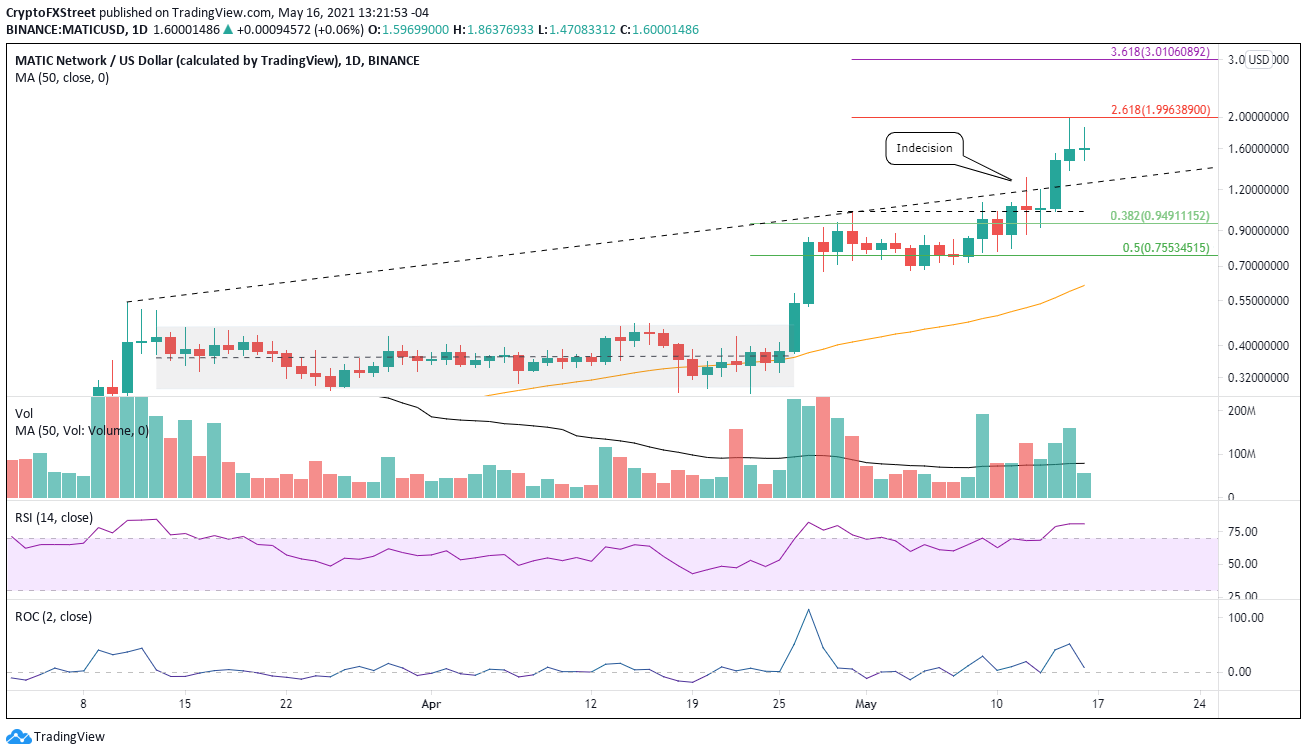
MATIC/USD daily chart
It should be expected for MATIC price to pullback at this point. Still, it needs to hold above the topside trend line currently at $1.26, or the bullish thesis may unravel with a deeper corrective process down to the 38.2% retracement of the April-May rally at $0.95.
Author

Sheldon McIntyre, CMT
Independent Analyst
Sheldon has 24 years of investment experience holding various positions in companies based in the United States and Chile. His core competencies include BRIC and G-10 equity markets, swing and position trading and technical analysis.



