MATIC Price Prediction: Polygon targets $4 after Mark Cuban investment
- MATIC price holds above the 50-day simple moving average (SMA) before rebounding near the all-time high.
- Polygon extreme overbought condition on the daily Relative Strength Index (RSI) has been eliminated during the May crash.
- Mark Cuban reveals he is an investor in the layer 2 Ethereum scaling solution.

MATIC price remains at the forefront of the cryptocurrency market despite the May crash, lifting Polygon within 30% of the all-time high. A rare feat considering the overall uncertainty hanging over the market. The digital token may experience a pullback after the 230% rebound from the May 23 low. Still, it is well-positioned to print new highs in the coming days and, as a result, use the relative strength to sponsor rebounds in weaker performing tokens.
Polygon now listed on Mark Cuban website
In an email, Mark Cuban confirmed an investment in Polygon but did not reveal its size. Cuban said that he is a Polygon user and finds himself “using it more and more.” He continued by saying that he’s integrating it into Lazy.com, a company that allows people to present their non-fungible tokens (NFTs).
Polygon COO Sandeep Nailwal called the Cuban investment “mind-blowing” and added:
It was so spectacular to know that the nuances of the industry, the tech and adoption we had figured out after months of grind, he was already thinking about those and had those questions in mind.
The phenomenal rise of Polygon is supported by the enviable position of being the leading network to escape the high transaction fees of the Ethereum mainnet, thereby successfully supporting the surging decentralized finance (DeFi) space as new active users multiply.
Such high-profile DeFi platforms like Curve Finance, Aave and mStable are now live on the network with the overall goal of offering faster and cheaper DeFi.
MATIC price takes FOMO in stride
Until May 19, MATIC price led the cryptocurrency market higher following a powerful breakout from a multi-week consolidation pattern formed in March and April. It was accompanied by a tremendous surge in volume and yielded extreme overbought conditions on the daily and week RSI.
MATIC price declined 70% from the high during the crash but struck support around the 50-day SMA at $0.791 and just above the 61.8% retracement of the April-May rally at $0.693 and the 2021 rising trend line at $0.645.
Today, MATIC price is meeting resistance at the 78.6% Fibonacci retracement of the May crash at $2.43, but it is within 30% of the all-time high at $2.89. Furthermore, Polygon is up 176% for May and is set to close with the fifth consecutive positive month, in a period marked by significant market gyrations and uncertainty.
Moving forward, outside of the 78.6% retracement level, MATIC price faces no technical challenges before attempting a new all-time high.
New profit targets are the 138.2% and 161.8% extension levels of the May decline at $3.72 and $4.23, respectively, generating a return of 60-90% from price at the time of writing.
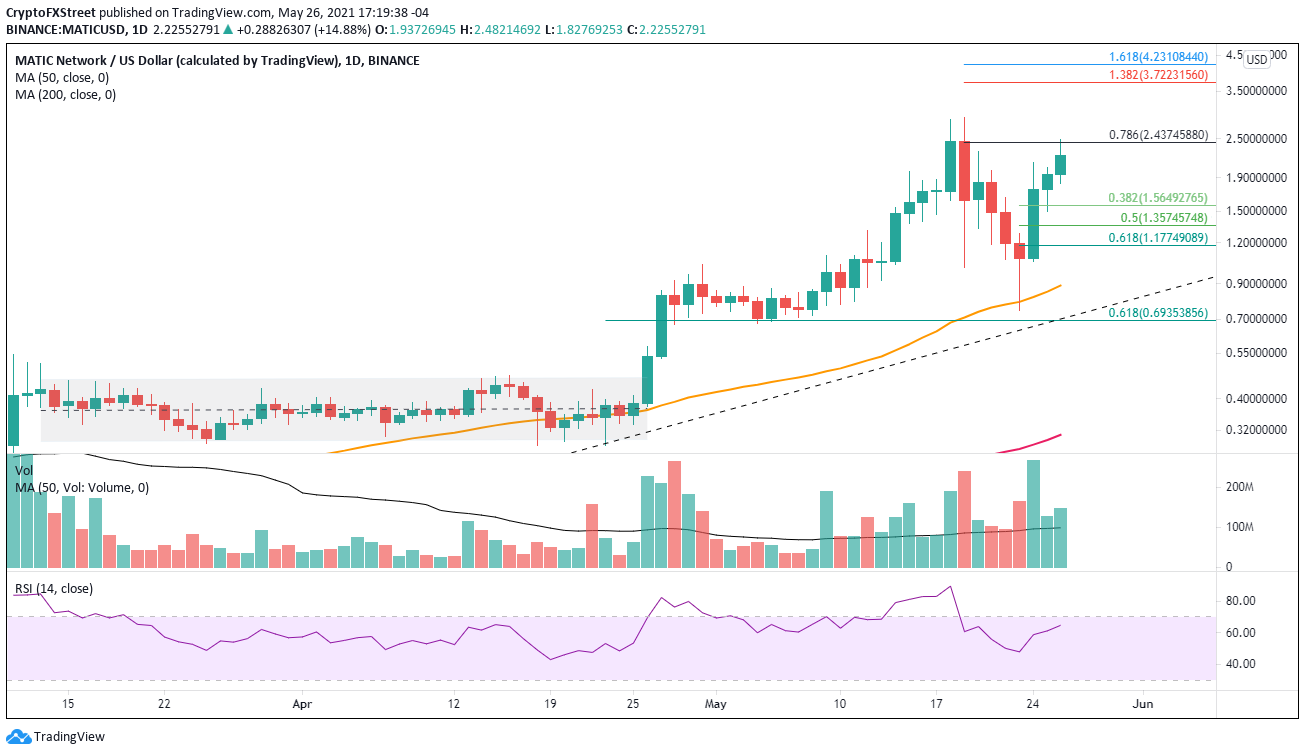
MATIC/USD daily chart
Unfortunately for Polygon investors, MATIC price could once again be engulfed by a new selling wave in the cryptocurrency complex. Levels of support include $1.84, the 38.2% retracement of the rally since May 23 at $1.56 and finally, the 61.8% retracement at $1.35.
Author

Sheldon McIntyre, CMT
Independent Analyst
Sheldon has 24 years of investment experience holding various positions in companies based in the United States and Chile. His core competencies include BRIC and G-10 equity markets, swing and position trading and technical analysis.



