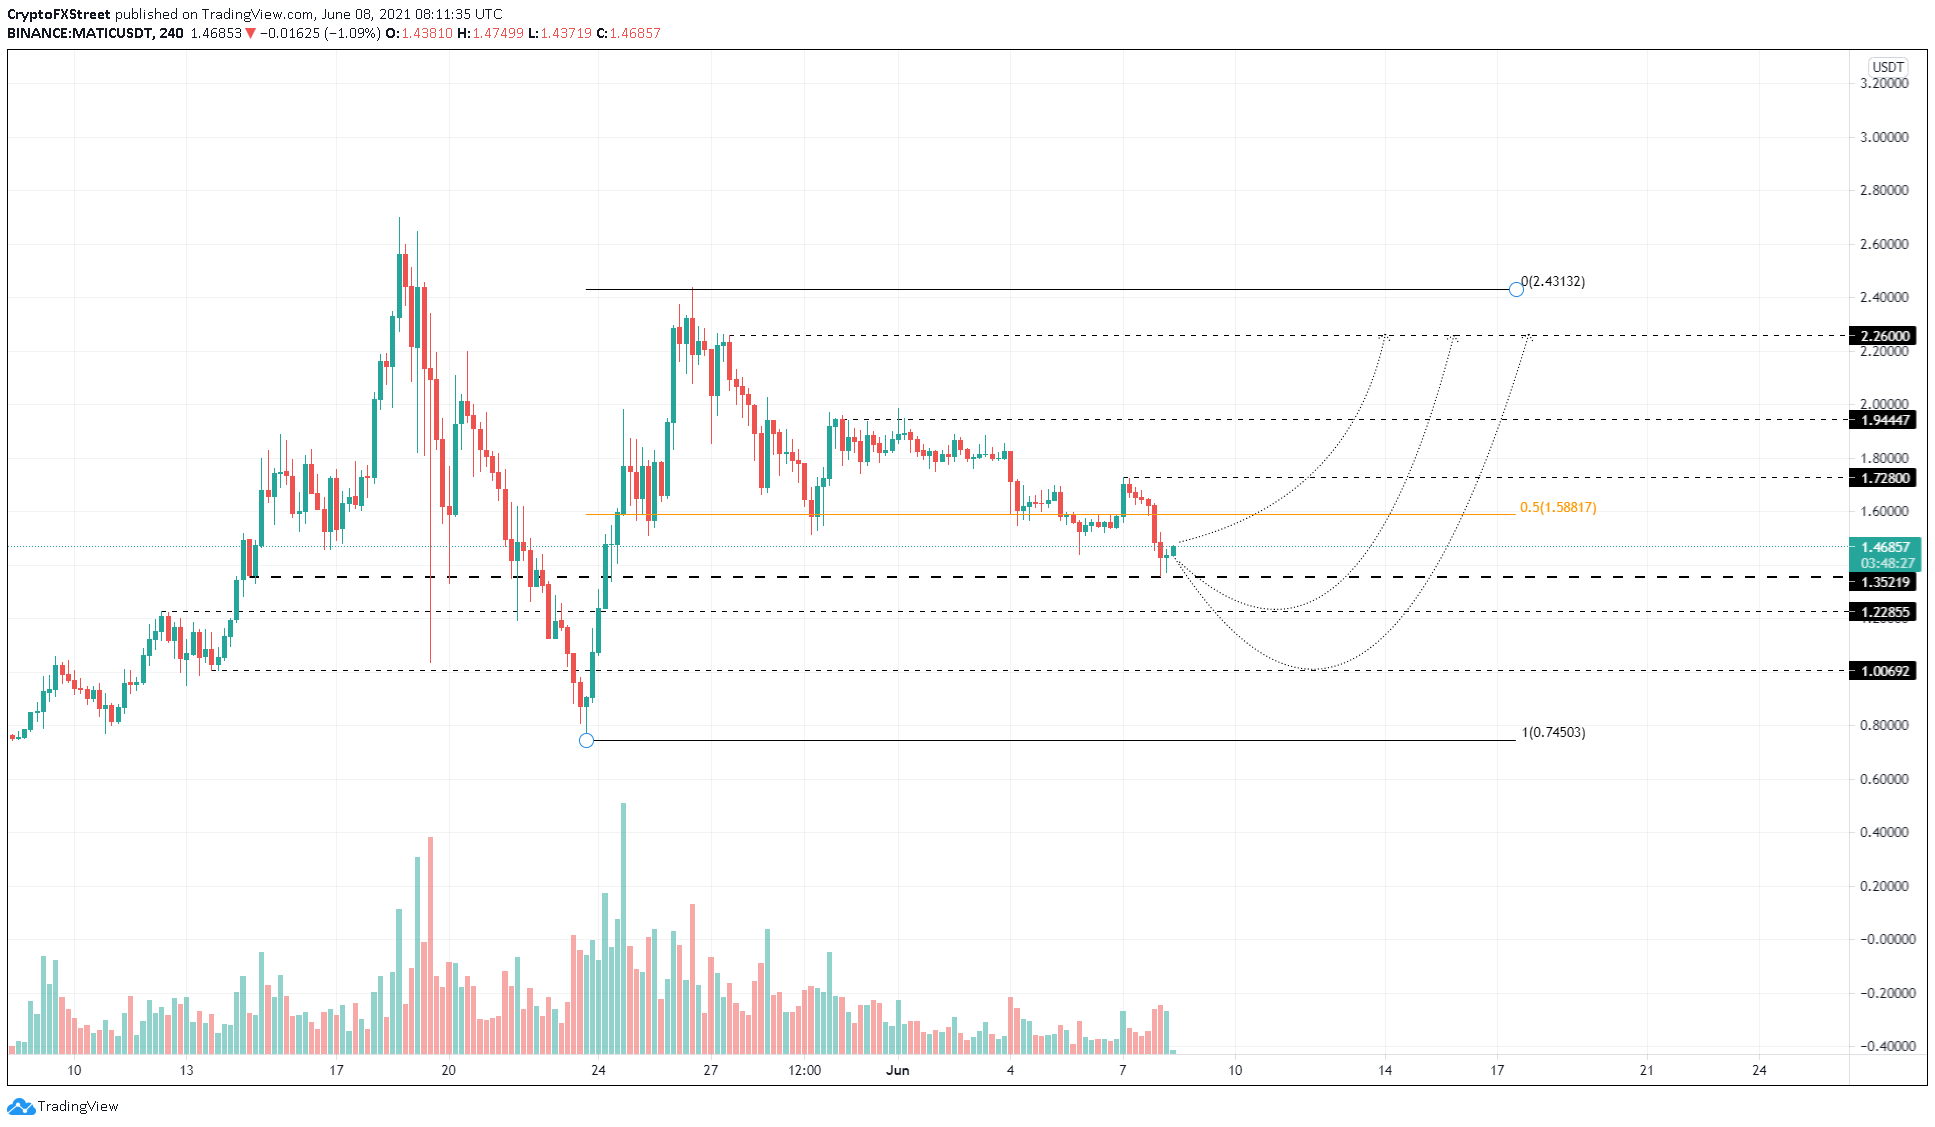
- MATIC price dropped to a support level at $1.352 as the crypto markets faltered on Monday.
- A reversal seems to be in the works, but transaction data hints at a continuation of the downtrend.
- Polygon will likely restart the uptrend if it produces a decisive close above $1.728.
MATIC price suffered a setback as it sliced through the equilibrium point and continued its descent. A bounce from the immediate support seems to have originated, but the chances of a down move are still present.
MATIC price drops below key level, bulls try to reverse action
MATIC price dropped below the 50% Fibonacci retracement level at $1.588 on Monday after teetering above it for a long time. This sell-off was part of a larger move that pushed the entire market lower.
As Bitcoin and other altcoins recover, Polygon price also shows signs of an uptrend. So far, MATIC has rallied 8% and hints at a continuation of the upswing. A decisive 4-hour candlestick close above the 50% Fibonacci retracement level at $1.588 will confirm the start of recovery.
However, a rejection at these levels could reignite the sell-off, sending Polygon spiraling.
If this were to happen, MATIC price would slice through the immediate support barrier at $1.352, followed by $1.229 and $1.
In extremely bearish conditions, Polygon could retest the range low at $0.745.
MATIC/USDT 4-hour chart
While the upswing might pose as a reversal sign, rejection at $1.588 or a fakeout above it could trap unbeknownst investors. Therefore, market participants need to exercise caution.
Polygon on-chain metrics show difficult path for bulls
Adding credence to the risky upswing narrative is IntoTheBlock’s In/Out of the Money Around Price (IOMAP) model, which shows large clusters of underwater investors present above the current position, $1.469.
Roughly 3,450 addresses that purchased nearly 109 million MATIC at an average price of $1.59 are “Out of the Money.” Hence, any short-term spike in buying pressure will most likely face selling pressure from investors who might want to break even.
Only 204 addresses that purchased 64 million MATIC at $1.46 are present as support levels. Therefore, it is likely that a momentary spike in selling pressure will easily topple the demand barriers.
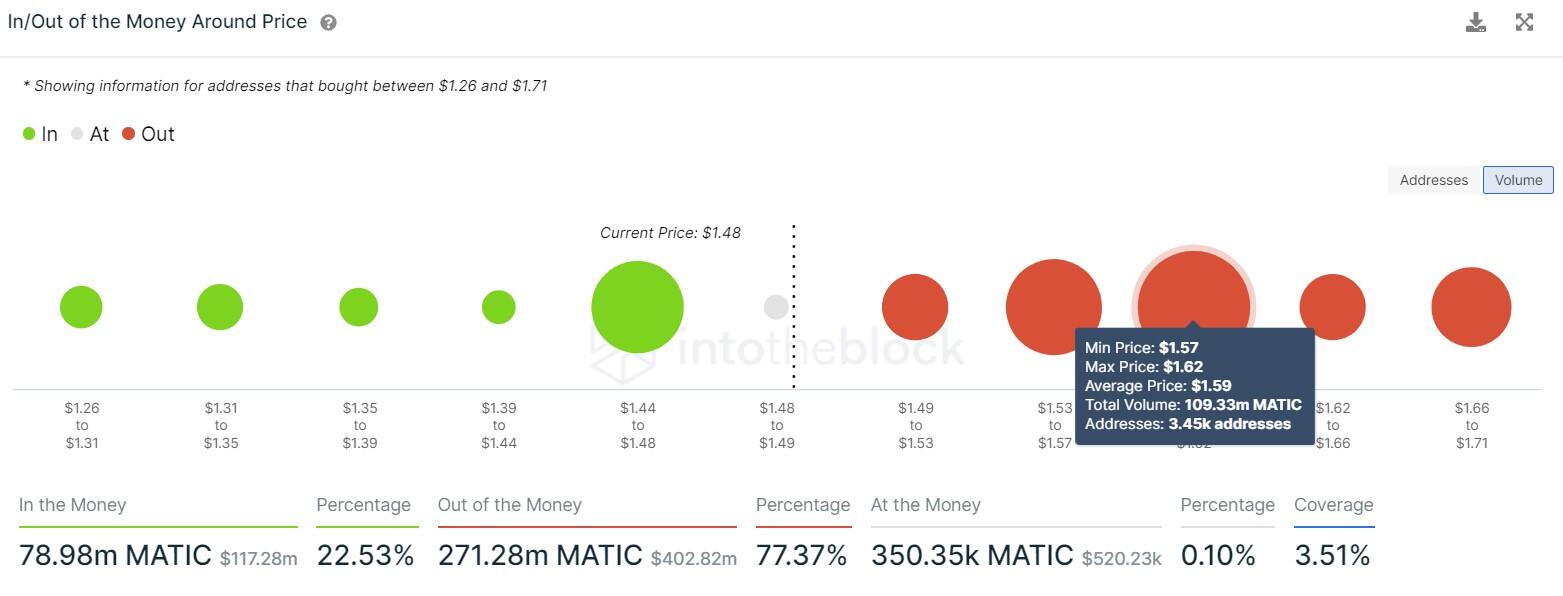
MATIC IOMAP chart
On the other hand, if MATIC price produces a decisive 4-hour candlestick close above $1.728, it will invalidate the bearish thesis and invoke a 13% rally to $1.944.
Breaching this level could push Polygon to $2.26.
Information on these pages contains forward-looking statements that involve risks and uncertainties. Markets and instruments profiled on this page are for informational purposes only and should not in any way come across as a recommendation to buy or sell in these assets. You should do your own thorough research before making any investment decisions. FXStreet does not in any way guarantee that this information is free from mistakes, errors, or material misstatements. It also does not guarantee that this information is of a timely nature. Investing in Open Markets involves a great deal of risk, including the loss of all or a portion of your investment, as well as emotional distress. All risks, losses and costs associated with investing, including total loss of principal, are your responsibility. The views and opinions expressed in this article are those of the authors and do not necessarily reflect the official policy or position of FXStreet nor its advertisers. The author will not be held responsible for information that is found at the end of links posted on this page.
If not otherwise explicitly mentioned in the body of the article, at the time of writing, the author has no position in any stock mentioned in this article and no business relationship with any company mentioned. The author has not received compensation for writing this article, other than from FXStreet.
FXStreet and the author do not provide personalized recommendations. The author makes no representations as to the accuracy, completeness, or suitability of this information. FXStreet and the author will not be liable for any errors, omissions or any losses, injuries or damages arising from this information and its display or use. Errors and omissions excepted.
The author and FXStreet are not registered investment advisors and nothing in this article is intended to be investment advice.
Recommended Content
Editors’ Picks
Ripple's move above this key level could trigger nearly 50% rally for XRP
Ripple has overcome a critical resistance level and flipped into a support floor on the weekly time frame. This development happened while XRP tightly consolidated for roughly 250 days. Investors can expect XRP to kickstart a massive rally.
Optimism price outlook with nearly $90 million worth of OP tokens flooding markets on Friday
Optimism volatility has shrunk in the ours leading to the network’s cliff unlock. It joins the likes of dYdX and Sui, which have similar events on their calendars. As token unlocks are often considered bearish catalysts, investors should brace for a reaction after the event.
Top 3 Price Prediction Bitcoin, Ethereum, Ripple: Retail watches from the sidelines with a bias for shorts
Bitcoin could clear $73,777 peak as BTC bulls resurface. Ethereum might fall 10% before next leg up as ETH RSI teases with sell signal. XRP could lose $0.6000 threshold as Ripple bulls fail to show up.
Jito price could hit $6 as JTO coils up inside this bullish pattern
Jito price action shows a potential cup and handle formation. Based on theoretical measurement rules, a successful breakout could yield a 56% rally to $6.0. A breakdown of the $3.86 support level would create a lower low for JTO and invalidate the bullish thesis.
Bitcoin: BTC may have recovered, but is it out of the woods?
Bitcoin’s (BTC) upward momentum has shown a significant decline for the past two weeks or so. This development led to a bearish signal on the weekly and an uncertain outlook on the monthly.