MATIC Price Prediction: Polygon prepares for an additional 17% drop
- MATIC price has formed a bearish chart pattern, suggesting another 17% fall is in the offing.
- Polygon could drop toward $1.245 before a rebound can be expected.
- Moving forward, the bulls will need to revisit $1.978 to avoid further losses.

MATIC price has presented a bearish chart formation that suggests a pessimistic narrative for the layer 2 token. An additional 17% plunge may be on the radar for Polygon following a break below a critical level of support.
MATIC price drops below crucial line of defense
MATIC price has sliced below the neckline of the head-and-shoulders chart pattern at $1.970 on the 12-hour chart on January 21, putting a bearish target of $1.245 on the radar.
The increase in selling pressure forced Polygon to cower below the critical support line which acted also as the neckline of the prevailing chart pattern at $1.970, coinciding with the 200 twelve-hour Simple Moving Average (SMA). This move had a huge impact on MATIC price, as the token has since lost 24% of its value.
While MATIC price continues to lose its strength, Polygon could continue sliding lower toward the first line of defense at the September 18 high at $1.440.
An additional foothold may emerge at the October 2 high at $1.352 before Polygon drops toward the pessimistic target at $1.245, which coincides with the September 23 high.
Lower levels are not expected to be targeted, but if a surge in sell orders occurs, Polygon may fall toward the 127.2% Fibonacci extension level at $0.978 before rebounding.
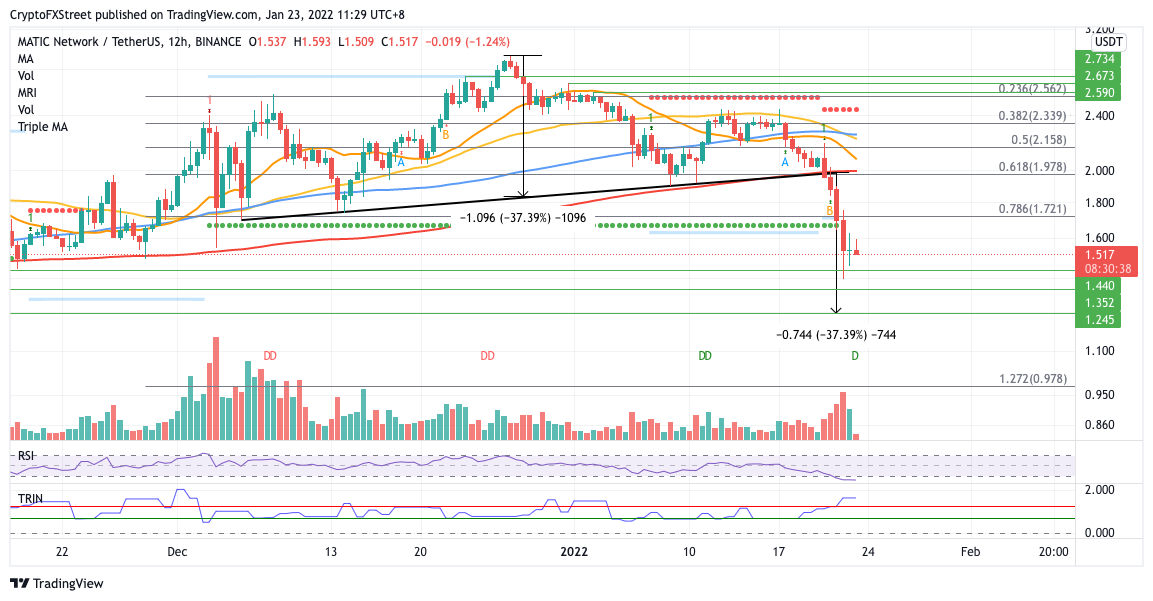
MATIC/USDT 12-hour chart
If buying pressure increases, Polygon may target the first level of resistance at the 78.6% Fibonacci retracement level at $1.721, then toward the neckline of the prevailing chart pattern at $1.970, coinciding with the 200 twelve-hour SMA and the 61.8% Fibonacci retracement level.
Bigger aspirations may aim for the 21 twelve-hour SMA at $2.09 next, then at $2.235, where the 50 twelve-hour SMA and 100 twelve-hour SMA intersect.
Author

Sarah Tran
Independent Analyst
Sarah has closely followed the growth of blockchain technology and its adoption since 2016.


