MATIC Price Prediction: Polygon future storyline may include a 60% decline
- MATIC price is now down 16% this week as the breakdown from a symmetrical triangle pattern gains momentum.
- The May low of $0.743 must provide support moving forward, or a more significant Polygon decline awaits.
- Most cryptocurrencies have tested or broken the strategically important 50-week simple moving average (SMA).

MATIC price continues the march lower that began on May 19, confirmed by the drop below the 2021 ascending trend line on June 21 and further confirmed by the breakdown from a 50-day symmetrical triangle pattern on July 8. Standing in front of a realization of the substantial measured move is the May low at $0.743, the March high at $0.544 and the 50-week SMA at $0.380. In this context, the 50-week SMA is of particular importance.
MATIC price humbled, leaving it at the mercy of the cryptocurrency market
MATIC price had been supported earlier in the year by the compelling fundamental story of the scaling solution on Ethereum, but the failing cryptocurrency market has replaced the interest in the Polygon legend.
The reversal of fortune leaves MATIC price in a vulnerable position of outsized losses moving forward. For most of the altcoin coins, the 50-week SMA has been a source of support, and in many cases, it has become an impenetrable resistance level. To align MATIC price with the 50-week SMA at $0.380, Polygon would need to tumble another 58% from the current price, erasing the rally that began at the end of April.
However, the downside may not be limited to $0.380. The measured move of the grand symmetrical triangle is almost 75% from the breakout point, predicting a final MATIC price of $0.251 and a drop of over 70% from the current price. A decline of that significance would best the 50-week SMA, the 38.2% Fibonacci retracement of the 2021 advance at $0.394 and the lows of the trading range that dominated Polygon in March-April at $0.287.
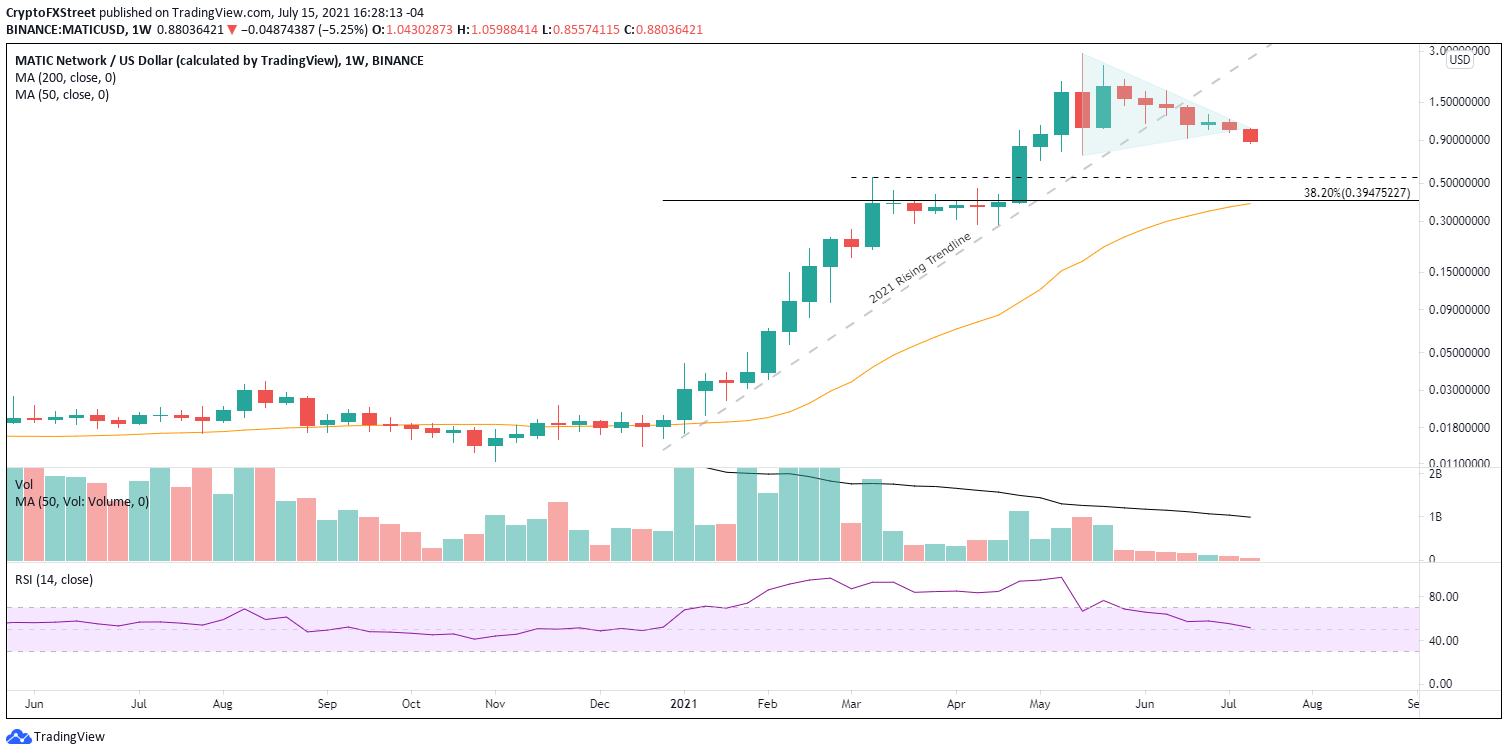
MATIC/USD weekly chart
To neutralize the bearish narrative, MATIC price has two objectives. First, achieve a daily close above the June 22 low of $.092 and then secure a daily close above the apex of the symmetrical triangle at $1.067. If successful, Polygon could consider a test of the declining 50-day SMA at $1.332, representing a 24% gain from the apex.
A final consideration is the daily Relative Strength Index (RSI). It is approaching an oversold reading that may trigger some bounce. However, if MATIC price cannot close above the levels highlighted above, the oversold RSI will only temporarily pause the bigger Polygon decline.
The resolution of the symmetrical triangle to the downside marked a significant inflection point for MATIC price and is forcing Polygon faithful to consider a shocking decline, one already experienced by most cryptocurrencies at this point.
To be clear, a 60% crash to the 50-week SMA is a relevant storyline, particularly when the overall cryptocurrency market fails to attract a firm bid.
Author

Sheldon McIntyre, CMT
Independent Analyst
Sheldon has 24 years of investment experience holding various positions in companies based in the United States and Chile. His core competencies include BRIC and G-10 equity markets, swing and position trading and technical analysis.




