MATIC price due for a pit stop before Polygon continues quest for new highs
- MATIC price strikes 50% retracement of the May-July cyclical correction at $1.75.
- Polygon is now flashing a bearish momentum divergence on the daily Relative Strength Index (RSI).
- MATIC price is on pace to close with five consecutive positive weeks for the first time since February.

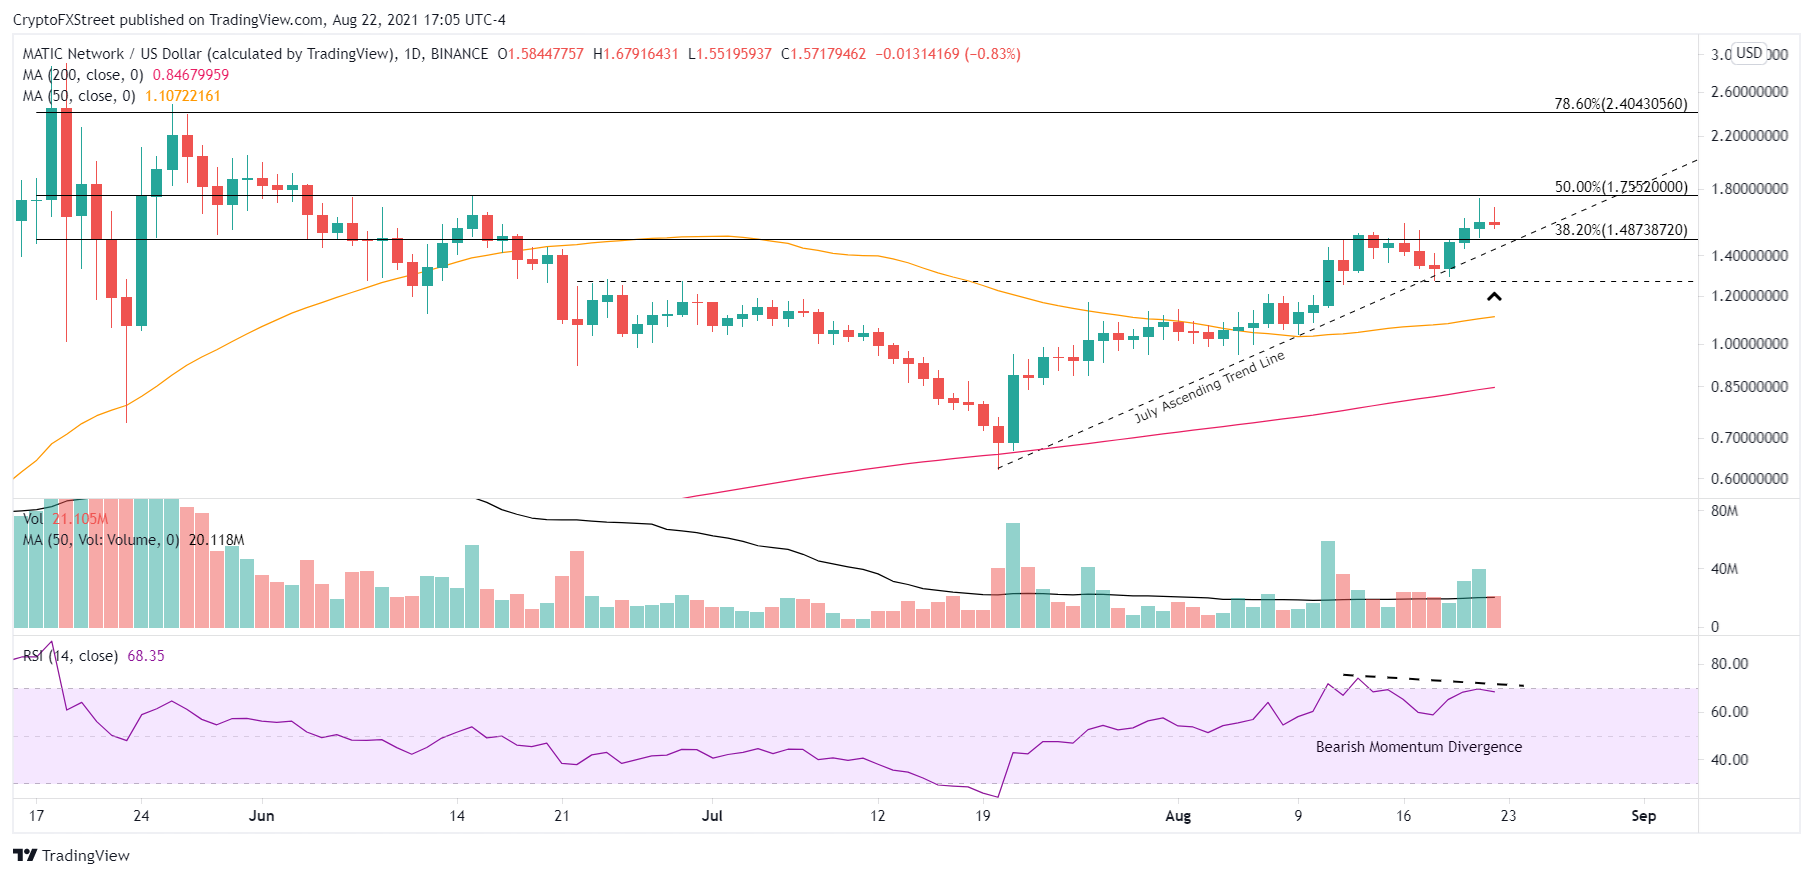
MATIC price reached the 50% retracement at $1.75 after confidently holding the July ascending trend line on August 18 and 19. However, the bearish momentum divergence, first visible on the intra-day timeframes, has expanded to the daily chart, confirming declining momentum for the Polygon rally that has already reached 180%.
MATIC price storms may be on the horizon
MATIC price shows a gain of 47% for August after closing July with a bullish hammer candlestick pattern that included a 29% thrust from the 200-day simple moving average (SMA) on July 21. Moreover, Polygon has rallied 180% from the July 20 low to yesterday’s high, positioning it as one of the better performing cryptocurrencies since the low and the 17th largest with a market capitalization of $10.91 billion.
The robust rally has carried MATIC price to the 50% retracement and the confluence of price congestion plotted in May and June. Simultaneously, Polygon is posting a bearish momentum divergence on the daily RSI, signaling waning momentum that was first picked up by the intra-day charts and discussed in this FXStreet article on August 16.
A bearish momentum divergence at significant resistance does favor a consolidation or some pullback for MATIC price. One scenario is for Polygon to transact between the 38% and 50% retracement levels, correcting in time versus price while holding the July ascending trend line. A second alternative would consist of MATIC price falling below the 38.2% retracement at $1.48 and the ascending trend line until finding support at a series of highs in June around $1.27, representing a 20% decline from the current price.
MATIC/USD daily chart
Conversely, MATIC price could shake off the bearish momentum divergence on the charts and pursue higher prices. Intimidating resistance arrives at the 78.6% retracement at $2.40, which aligns with the May 26-27 highs and the May 18 close of $2.44, yielding a 50% gain from the current Polygon price.
Polygon has been one of the headline stories in 2021, as the layer 3 blockchain project allows developers to optimize their applications. Some of the notable apps to migrate to the network include Aave, SushiSwap and Curve Finance. With the DeFi giants opting for the network, it will surely attract more developers, facilitating a better price in the months ahead.
For now, MATIC price should pause, laying the groundwork for the next leg higher to the 78.6% retracement at $2.40 or the all-time high of $2.89.
Here, FXStreet's analysts evaluate where Polygon could be heading next as it consolidates.
Author

Sheldon McIntyre, CMT
Independent Analyst
Sheldon has 24 years of investment experience holding various positions in companies based in the United States and Chile. His core competencies include BRIC and G-10 equity markets, swing and position trading and technical analysis.