MATIC price joins the frenzy for altcoins, but Polygon flashes a new warning signal
- MATIC price closes with the best weekly performance since May, positioning the cryptocurrency near the crucial $1.75 resistance.
- A bearish momentum divergence is visible on several intra-day timeframes.
- Polygon located firm resistance at the 38.2% Fibonacci retracement at $1.48.

MATIC price has struck considerable resistance around $1.50 after a pair of explosive sessions on August 11 and August 13, culminating in the best weekly performance since May. The Polygon outlook remains constructive, but the appearance of a bearish momentum divergence on several timeframes suggests that a test of the 50% retracement level at $1.75 may have to wait.
MATIC price met by challenges as highs come into view
MATIC price shows a gain of 38.50% for August after closing July with a bullish hammer candlestick pattern that included a 29.00% thrust from the 200-day simple moving average (SMA) on July 21. Moreover, Polygon has rallied 117.60% from July 21 at the current price, solidifying it as one of the better performing altcoins since the low.
The robust rally has pushed MATIC price beyond the daily Ichimoku Cloud to the 38.2% retracement, registering the first overbought reading on the daily Relative Strength Index (RSI) since mid-May.
A red flag during the Polygon rally has been the general lack of volume surges on positive days, excluding July 21 and August 11. It reflects a reluctance within the cryptocurrency investor ranks and is confirmed by the daily chart’s many doji candlestick patterns.
A new obstacle for continuing the rally is the appearance of a bearish momentum divergence, projecting some form of consolidation or pullback in MATIC price in the short term.
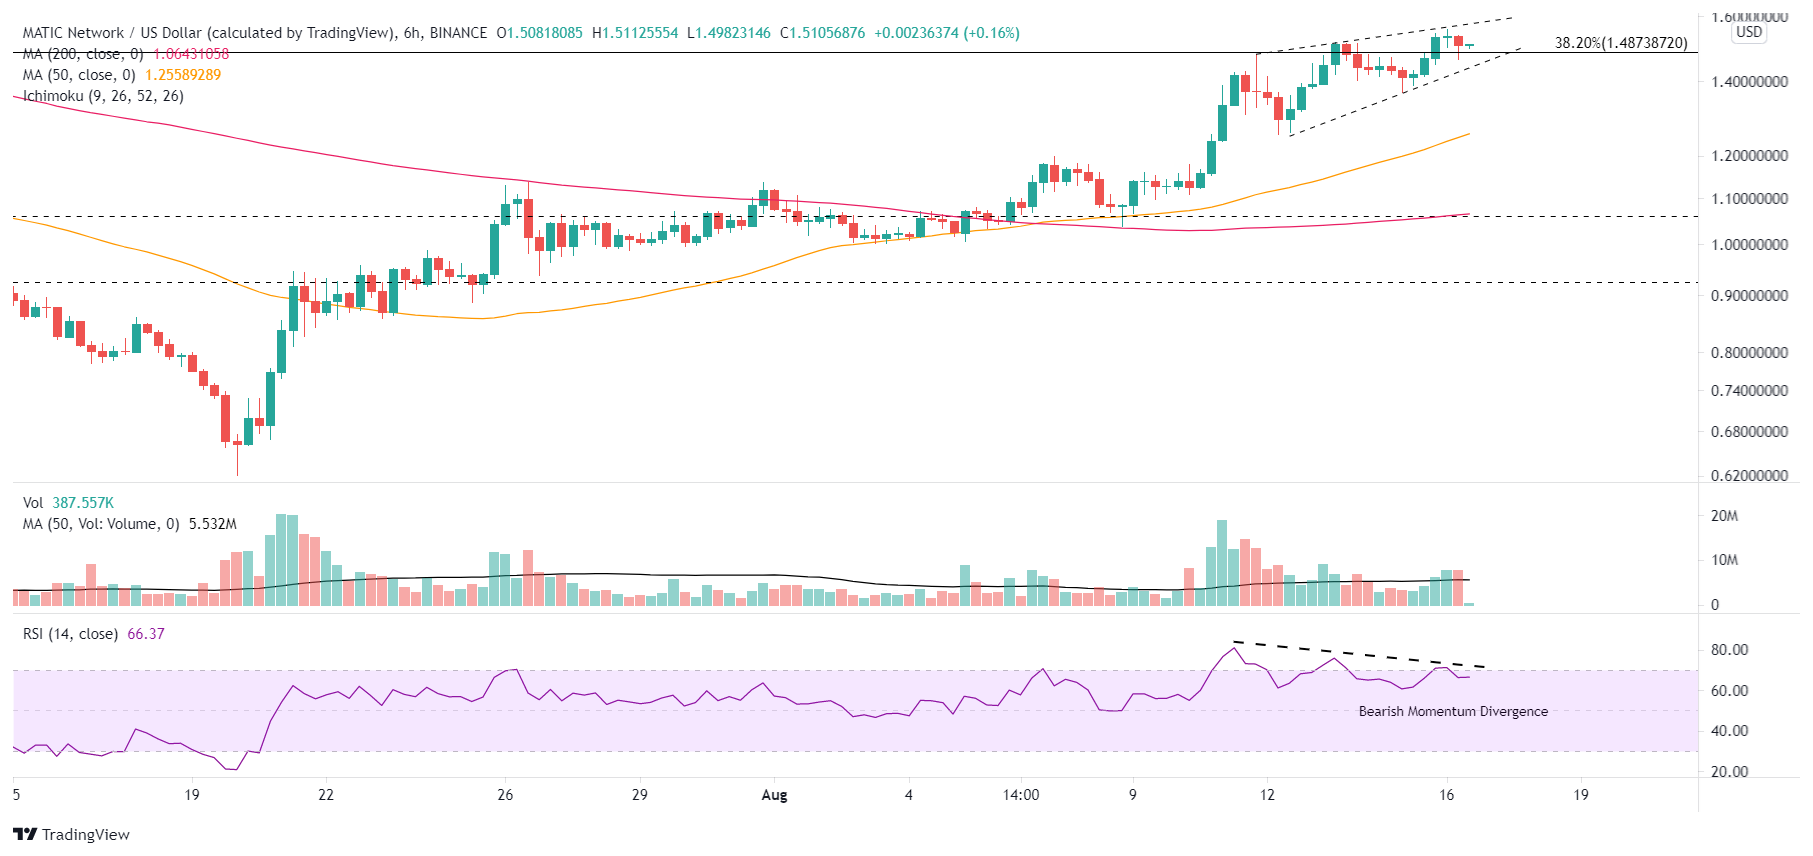
MATIC/USD 6-hour chart
A significant level of support for a minor MATIC price correction is the union of the late June highs around $1.25-$1.27 with the daily Ichimoku Cloud at $1.30, the July ascending trend line around $1.25 and the 50 six-hour SMA, also at $1.25, representing a 16% decline from the current Polygon price.
MATIC price could ignore the bearish momentum divergence and resolve the rising wedge on the intra-day charts to the upside, putting Polygon on the trajectory to test the 50% retracement level at $1.75. The retracement level aligns with some price congestion associated with the late-May and early-June highs.
A MATIC price breakthrough at $1.75 will identify resistance at $2.48 before aggressively pursuing the all-time high of $2.89, printed on May 19 and delivering a 93% return from the current Polygon price.
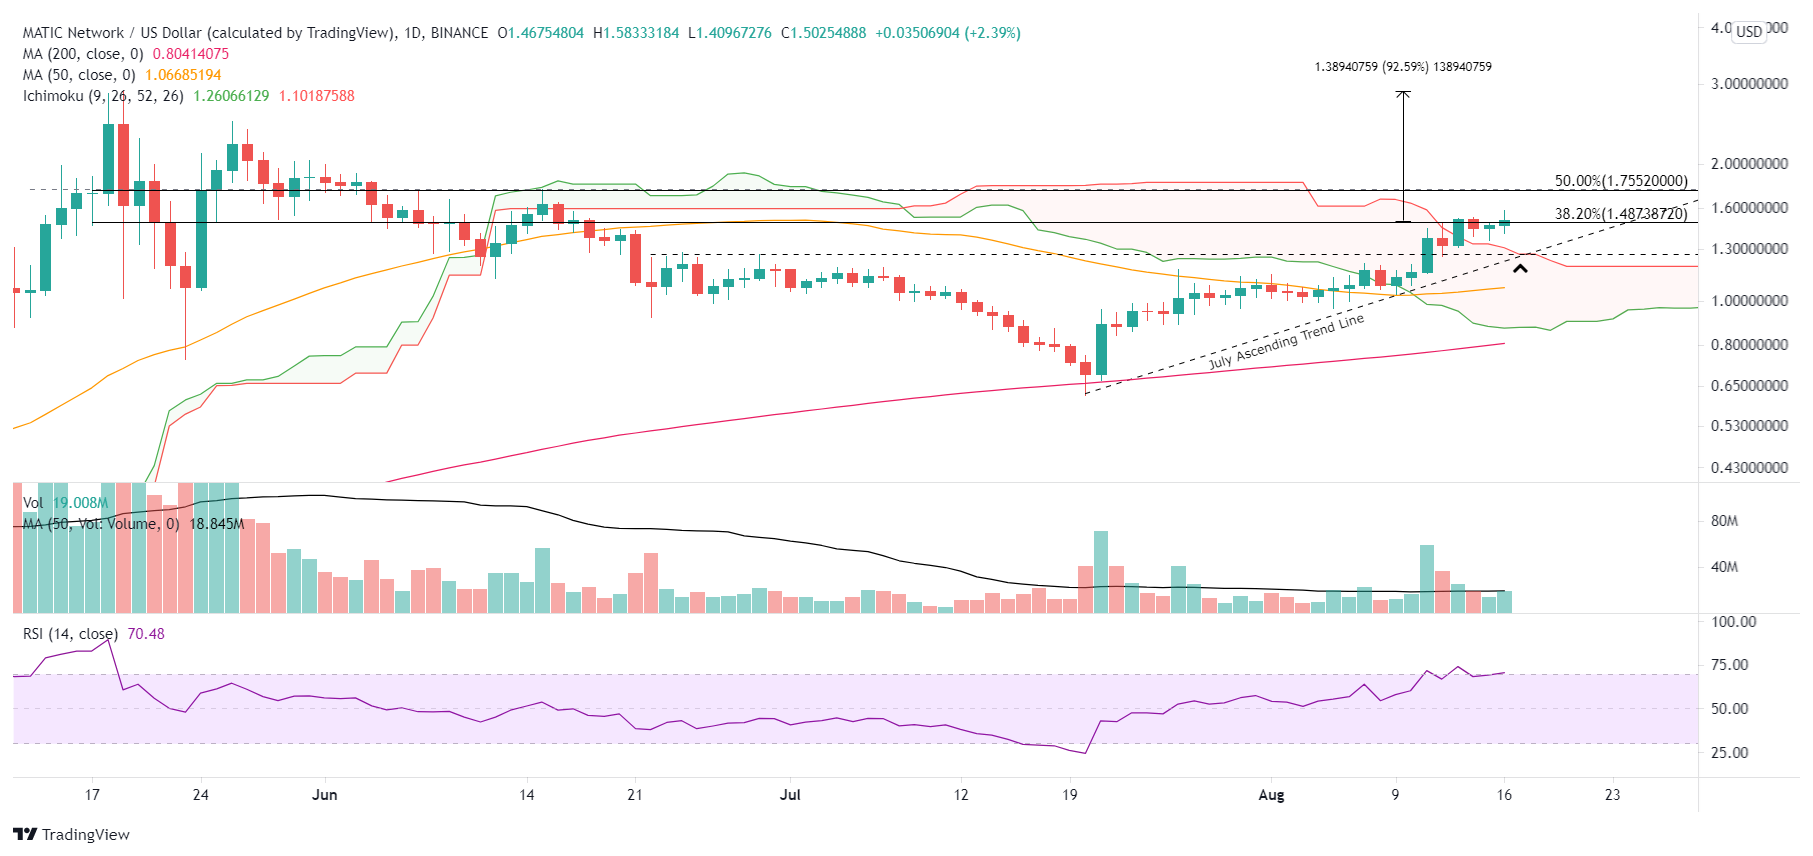
MATIC/USD daily chart
Like many altcoins, MATIC price enjoyed a strong week, carrying Polygon through the Ichimoku Cloud to the 38.2% retracement at $1.48. However, the presence of a bearish momentum divergence at the retracement level does increase the probabilities that Polygon will experience some form of correction that could test the July ascending trend line before resuming the uptrend.
Here, FXStreet's analysts evaluate where MATIC price could be heading next as it seems primed for further gains.
Author

Sheldon McIntyre, CMT
Independent Analyst
Sheldon has 24 years of investment experience holding various positions in companies based in the United States and Chile. His core competencies include BRIC and G-10 equity markets, swing and position trading and technical analysis.


