MATIC price caught in tight range as Polygon uptrend grinds forward
- Polygon price saw bulls trying to break to the upside above the 55-day SMA last week.
- MATIC price has been on the descent this week, but bulls keep pushing the lows higher with heavy buying on the dips this week and previous weeks.
- The longer-term uptrend is still very much intact, with the 200-day SMA still tilted to the upside.

Polygon (MATIC) price saw bears trying to break the longer-term uptrend MATIC is in with the 200-day Simple Moving Average (SMA) as a supporting technical indicator.
Bears in MATIC price action were able to break below the 200-day SMA for two weeks in September, but bulls kept buying the dips, which resulted in higher lows since the week of September 20. To the upside, the 55-day SMA is forming a cap for any upside potential, but the grind in the 200-day SMA should eventually open up more upside in favor of the bulls in the coming weeks.
MATIC price sees bulls continuing the uptrend toward $1.80
MATIC price sees bulls coming in and buying the dip each week on the lows, causing the weekly candles to show higher lows. Although this squeeze has been going on for four weeks, without really making many new highs, it shows the trend will take quite some time to get done. With bulls reclaiming $1.19, the squeeze against the bears should be gaining some speed.
MATIC price saw bears defending $1.40 and are trying to make a lower high against the one from last week. In that downward move, bears were able to reclaim the 55-day SMA at $1.35.
Expect the 200-day SMA to outweigh the 55-day SMA. As price action in MATIC will still move to the upside, the 55-day SMA will start to tilt to the upside as well, and bulls will get an opportunity to tip the scale in their favor and jump toward $1.80.
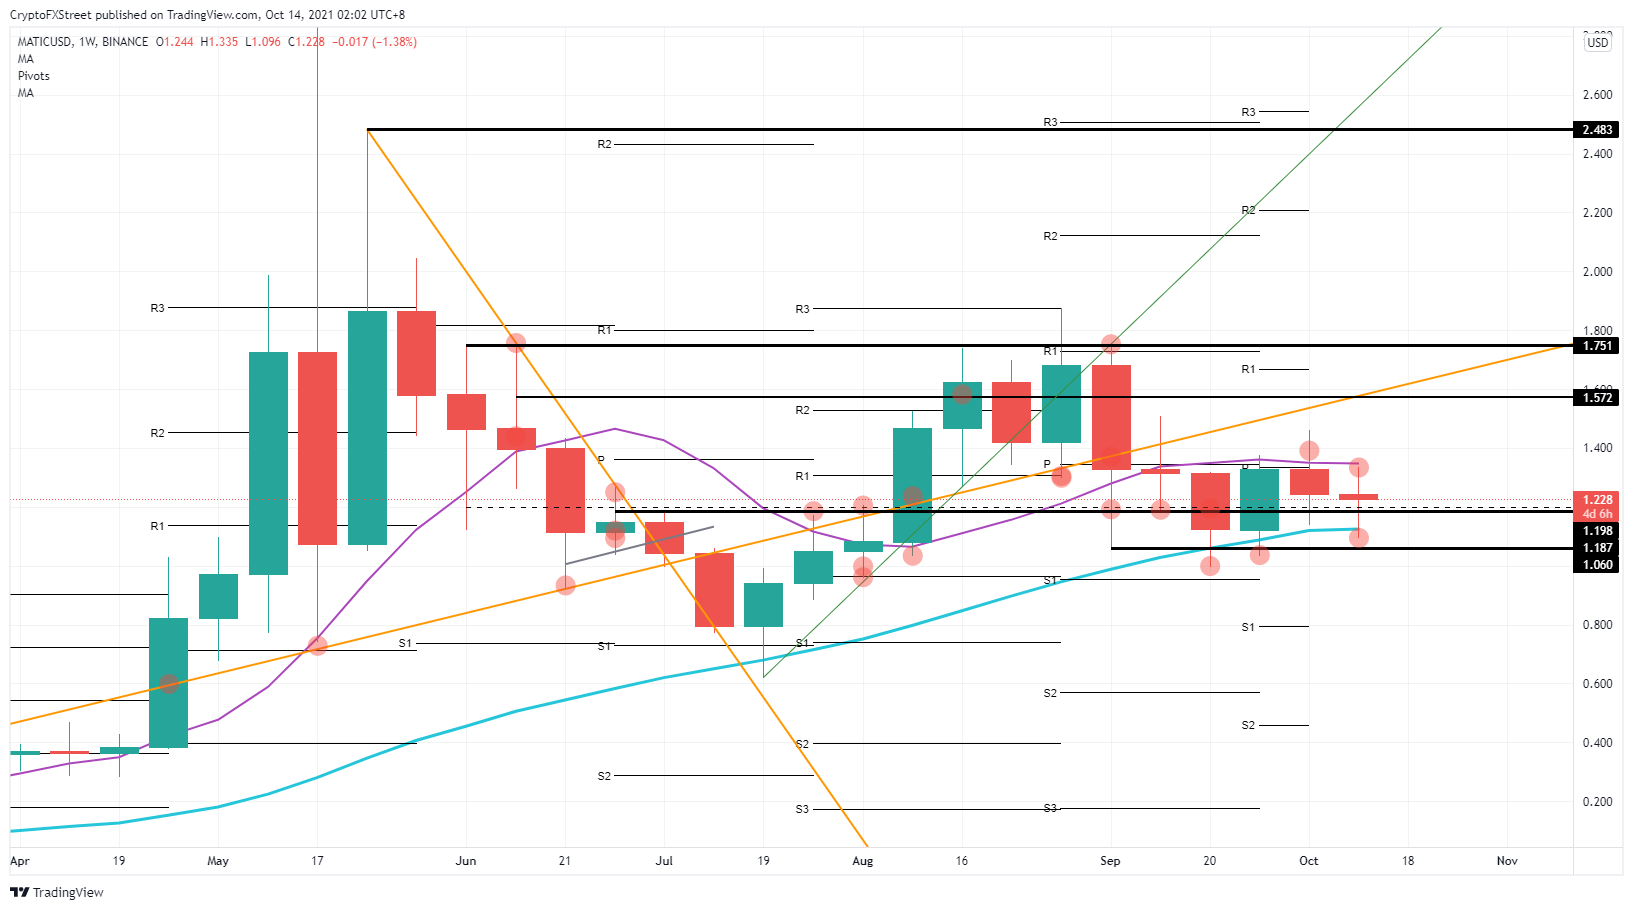
MATIC/USD weekly chart
In case bears can add some headwinds in MATIC price action, for example, with a disappointing earnings season and the stock markets selling off again for a few days, investors will start to look for safe havens. Cryptocurrencies will be the first on the chopping block. Expect bulls to exit their positions quickly, and MATIC price action could correct to $0.20.
Author

Filip Lagaart
FXStreet
Filip Lagaart is a former sales/trader with over 15 years of financial markets expertise under its belt.



