Three reasons why Polygon's MATIC token is targeting $300
- MATIC price is currently approaching the apex of the bull pennant pattern, suggesting an 18,632% advance.
- The RSI and MACD indicators support this bullish outlook.
- On-chain metrics suggest that Polygon’s ascension will not face massive hurdles.

MATIC price has been in a consolidation phase for nearly four months, giving rise to a gigantic bullish pattern. As Polygon approaches a breakout point, investors can expect the altcoin to shoot into the stratosphere.
MATIC price coils up
MATIC price shows an optimistic outlook due to the formation of a bullish pennant. The 18,650% surge that took place between December 2020 and May 2021 created the flagpole, while the ongoing consolidation period that followed made the “pennant.”
This continuation pattern signals an 18,650% upswing to $287, determined by measuring the flagpole’s height and adding it to the breakout at $1.543.
Therefore, a three-day candlestick close above $1.543 or the pennant’s upper trend line is imperative for the bullish outlook to play out.
While the above target is highly optimistic, investors must understand that the rallies are often overextended in bull runs. However, a much more conservative approach forecasts a 100% upswing to $3.09, a new all-time high, which is obtained by measuring the distance between the flagpole’s top to bottom and adding it to the breakout point.
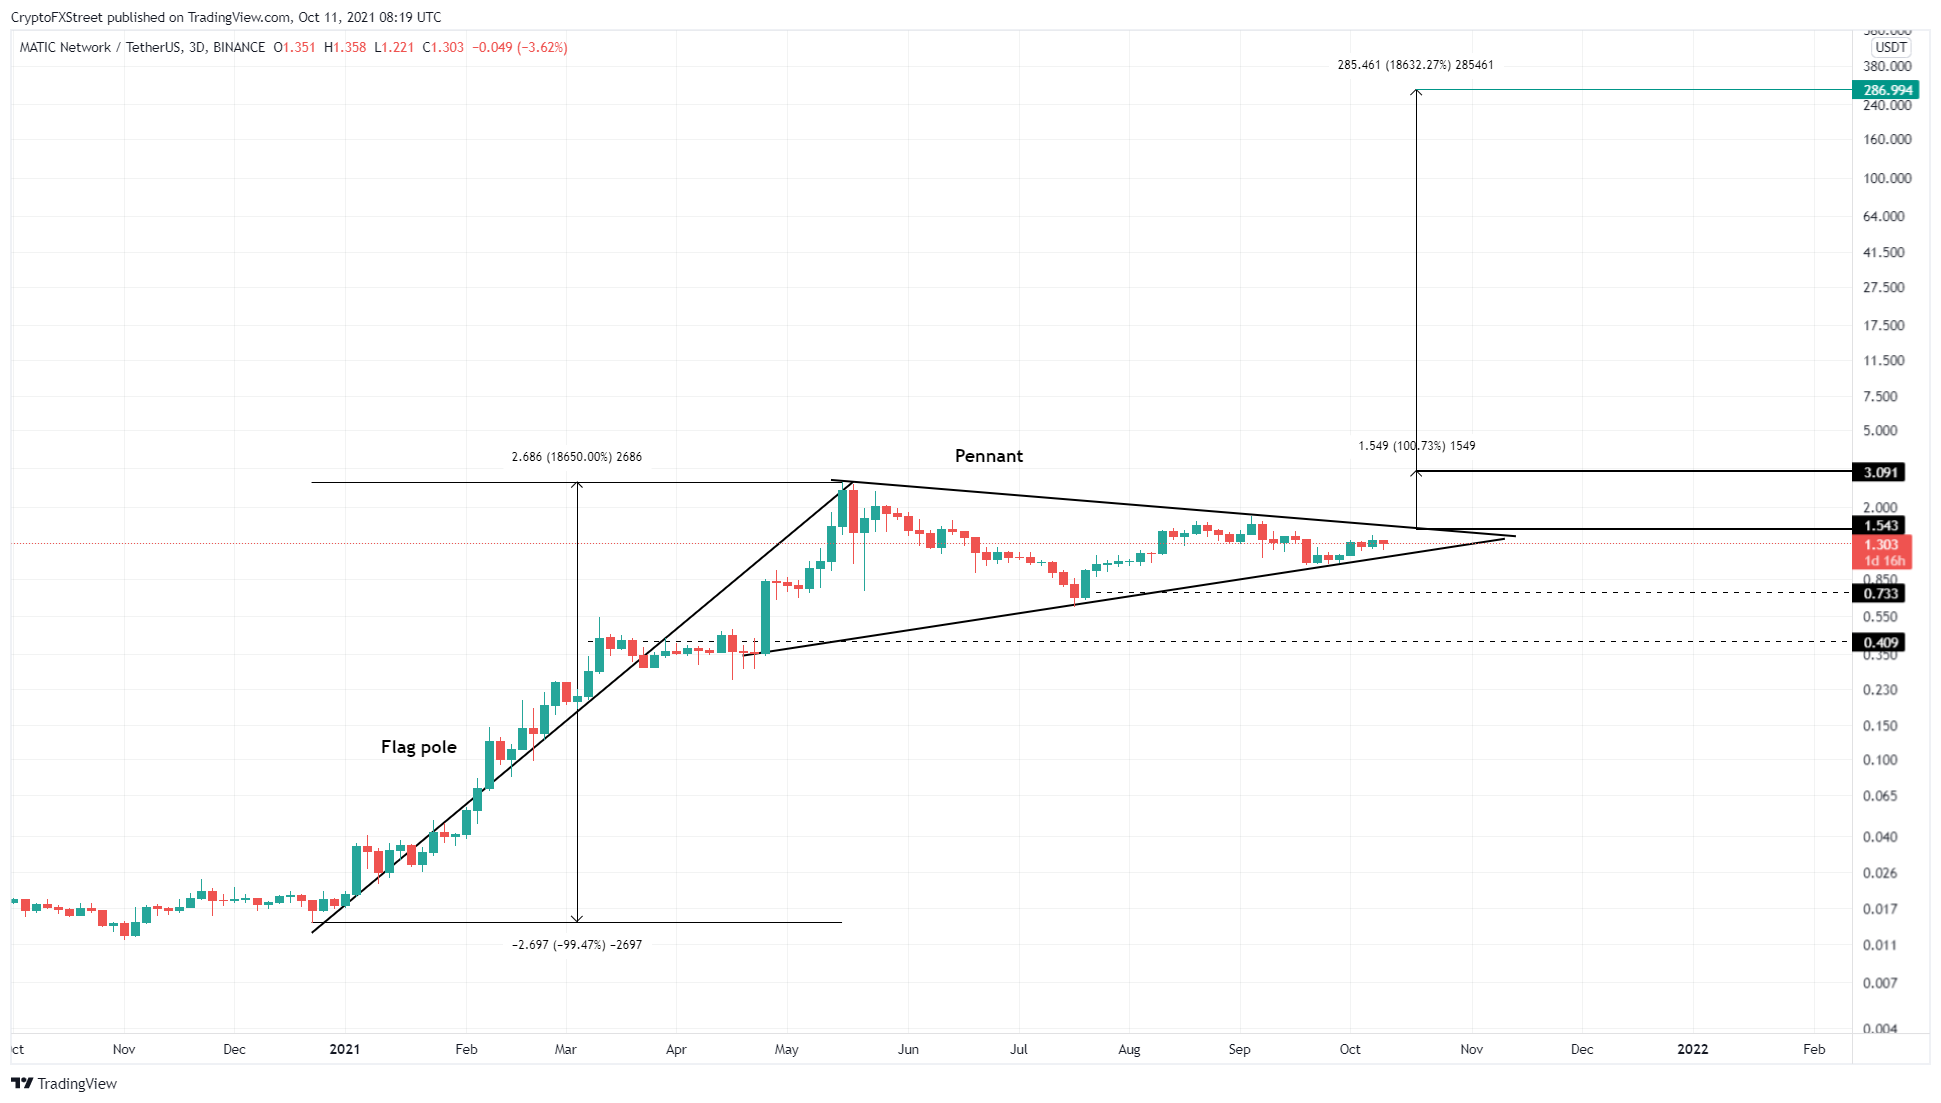
MATIC/USDT 3-day chart
Technicals hint massive gains for Polygon
While this outlook is positive, the Relative Strength Index (RSI) suggests that MATIC price has recently tagged the 44.95 level and is in for a bounce. Interestingly, Polygon ricocheted off the same barrier before it began its exponential upswing in late December 2020.
If RSI closes above the declining trend line that connects the lower highs formed since MATIC price’s all-time high in May 2021, it will serve as a secondary confirmation to the start of a bull rally.
Moreover, the Moving Average Convergence Divergence (MACD) shows a recovery as the MACD or the fast-moving line (blue) is climbing higher while the Signal or the slow-moving line (orange) is declining. If this trend continues, the MACD line will move above the Signal line, indicating a bullish crossover that adds a tailwind to the scenario mentioned above.
On-chain metrics reveal resistance-free path
IntoTheBlock’s Global In/Out of the Money (GIOM) model shows that MATIC price has few non-threatening resistance levels to clear. As seen in the chart below, a decisive daily candlestick close above $1.74 will push the 33,710 addresses that purchased 211.79 million MATIC tokens from “Out of the Money” to “Into the Money,” relieving the sell-side pressure and serving as a tailwind to the optimistic outlook.
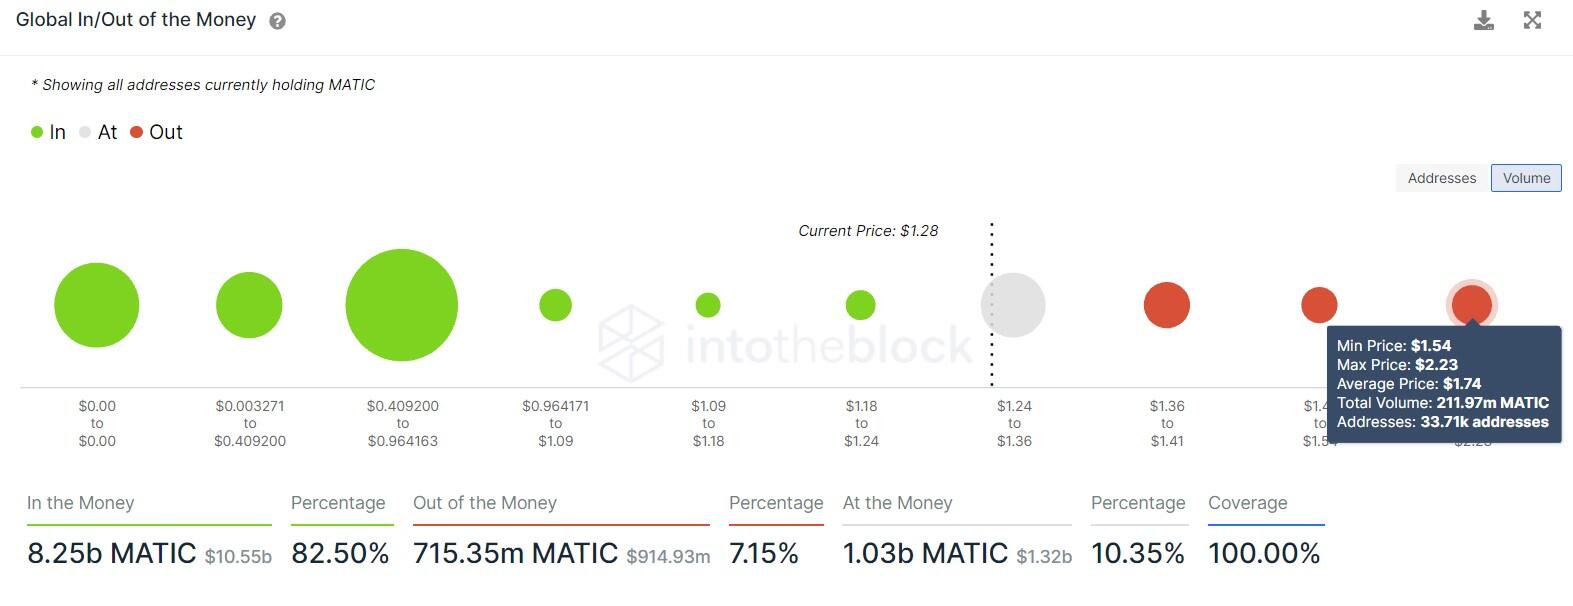
MATIC GIOM chart
On the other hand, the 365-day Market Value to Realized Value (MVRV) model for Polygon is hovering around 66.8%. This on-chain metric is used to identify if the holders that purchased MATIC over the past year are in profit/loss. A higher MVRV number is bearish since it suggests a large number of investors are in profit and might be inclined to book profits by selling.
While 66.8% is relatively high, the MVRV history for MATIC shows that a local top typically occurs around 146% (as it did in April 2020) or 350% (as seen during the 2021 bull rally).
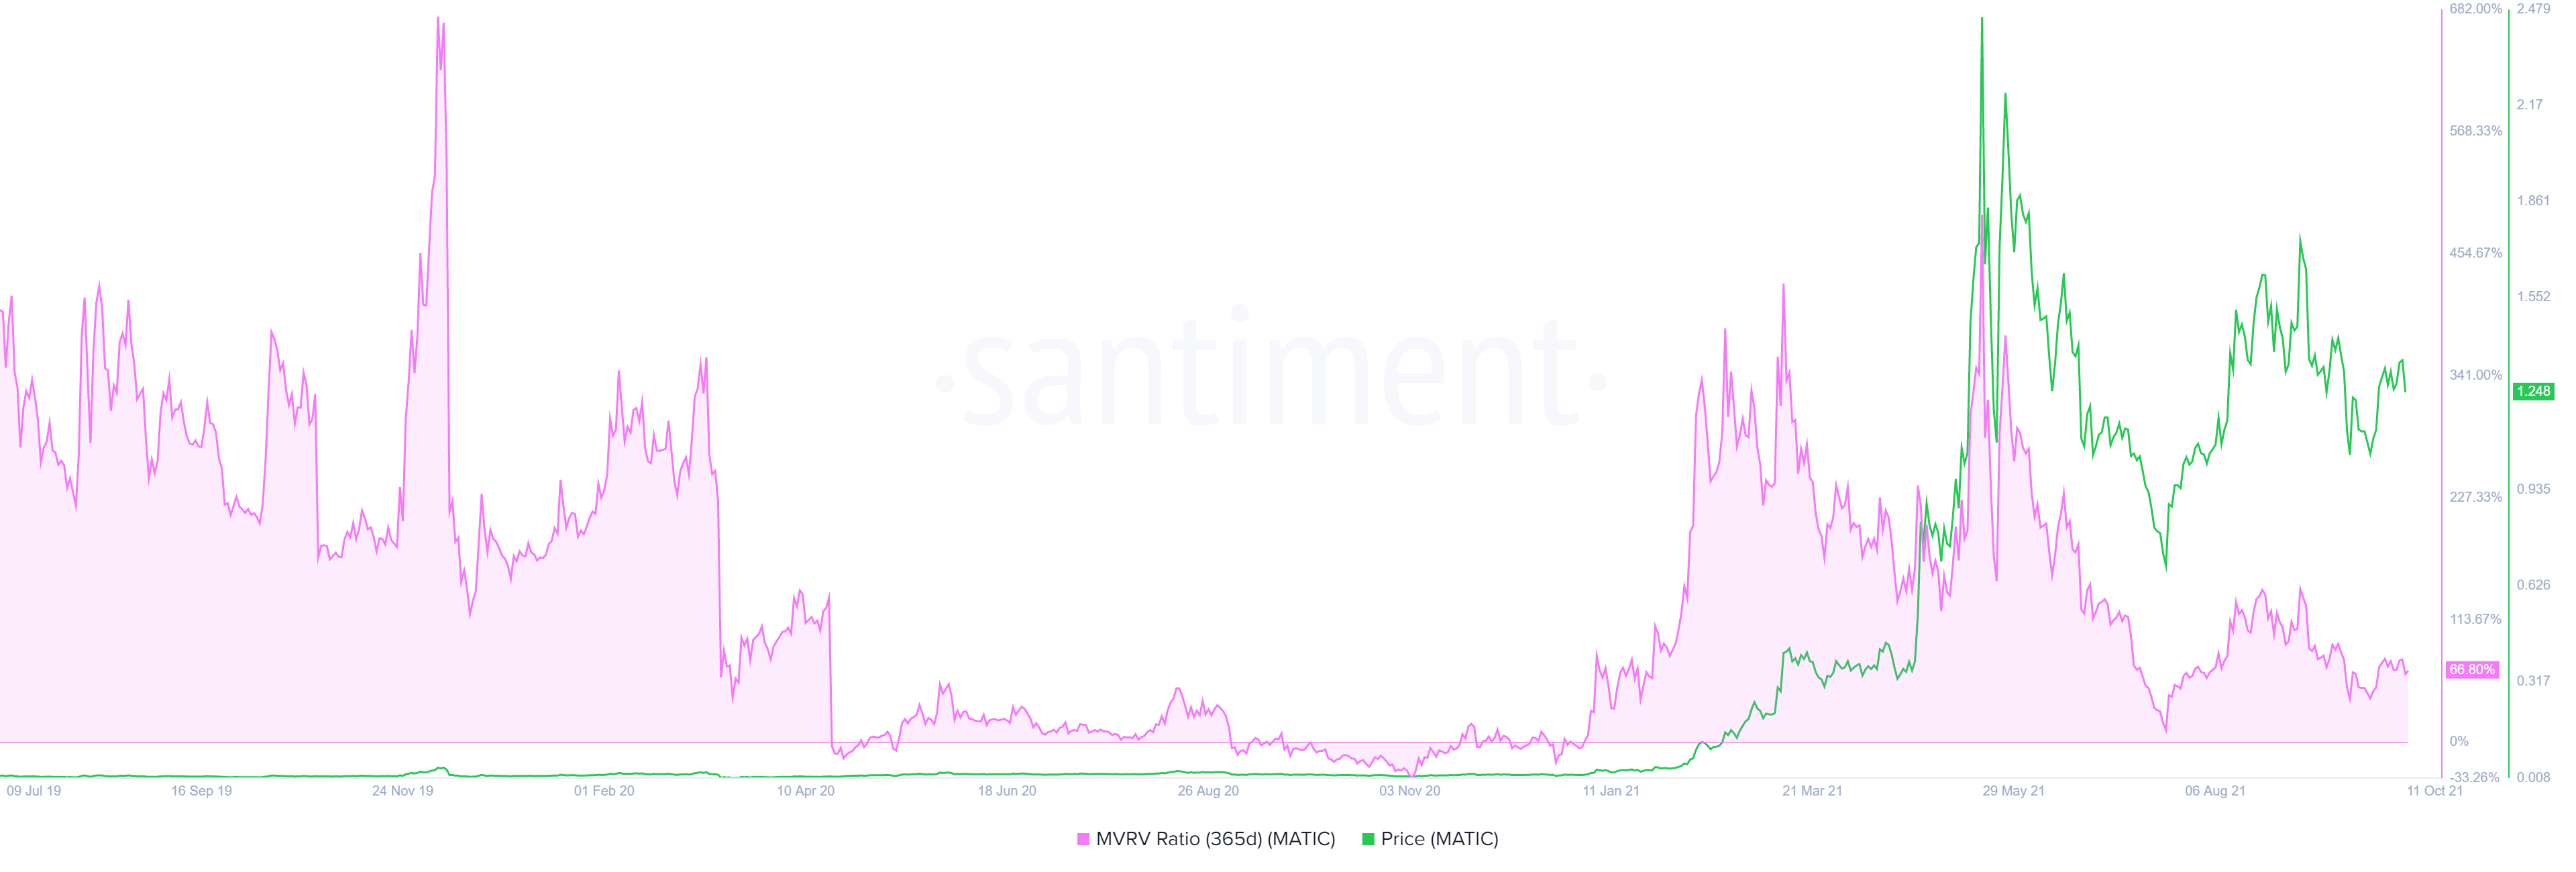
MATIC 365-day MVRV chart
Although the targets for MATIC price might seem unattainable, investors should note that the last quarter has been great for bull runs from a historical perspective. Regardless, the bullish outlook for Polygon is dependent on the assumption that the buyers will push MATIC price to slice through the pennant’s upper trend line at $1.543. However, a failure to do so could indicate a weakness among buyers.
Moreover, GIOM also reveals that the support levels are scarce up to $1.05. Therefore, a potential spike in selling pressure that pushes Polygon to shatter the lower trend line at $1.14 will result in a bearish breakout. If this downswing produces a lower low below $1, it will invalidate the bullish thesis.
In such a situation, MATIC price might correct 30% to tag the $0.733 support floor.
Author

Akash Girimath
FXStreet
Akash Girimath is a Mechanical Engineer interested in the chaos of the financial markets. Trying to make sense of this convoluted yet fascinating space, he switched his engineering job to become a crypto reporter and analyst.


