MATIC price at crossroads for the year as winter could turn up the heat in crypto
- Polygon price action prints a slight fade on Monday in front of the monthly R1 pivot level.
- MATIC price action sees two technical indicators set to cross one another.
- Should the crossing extend, a golden period with plenty of profit is nearby.

Polygon (MATIC) price action saw traders putting forward their bets for the fall and winter as price action rocketed 8%. A small fade this Monday morning is not that strange: China markets tanked massively, and the nearby vicinity of the monthly R1 resistance level is triggering some profit-taking. Two big important technical indicators are trading almost at the same price and could be seen crossing into a bullish sentiment outlook for the coming months.
MATIC price set for a bullish blitzkrieg of 33% gains
Polygon price action saw a massive wave of bullishness on Sunday as price action jumped over 8% for the day. That move hit $0.909 on Monday morning, which is very near the monthly R1 resistance level at $0.920. Today's fade is quite normal, seeing that Asian stock markets tanked over 6% and some China tech stocks declined even more than 10%, with big names like Alibaba and Tencent on the back foot after the China Party Congress. It is possible that a big position switch is happening as the 55-day Simple Moving Average (SMA) is set to cross the 200-day SMA.
MATIC price action will probably rally firmly over the coming weeks and months, following the MA cross. This could be a reflection of the fact that the worst has been priced in now, and it is just a matter of buying into the market at what is likely to be the year's low. MATIC price action could see a pop above $0.96 this week, breaking above the high of July 20th, 2021. This opens room and prospects for a move beyond $1 to $1.20 at the high of July 4, 2021, which is near the monthly R3 resistance level.
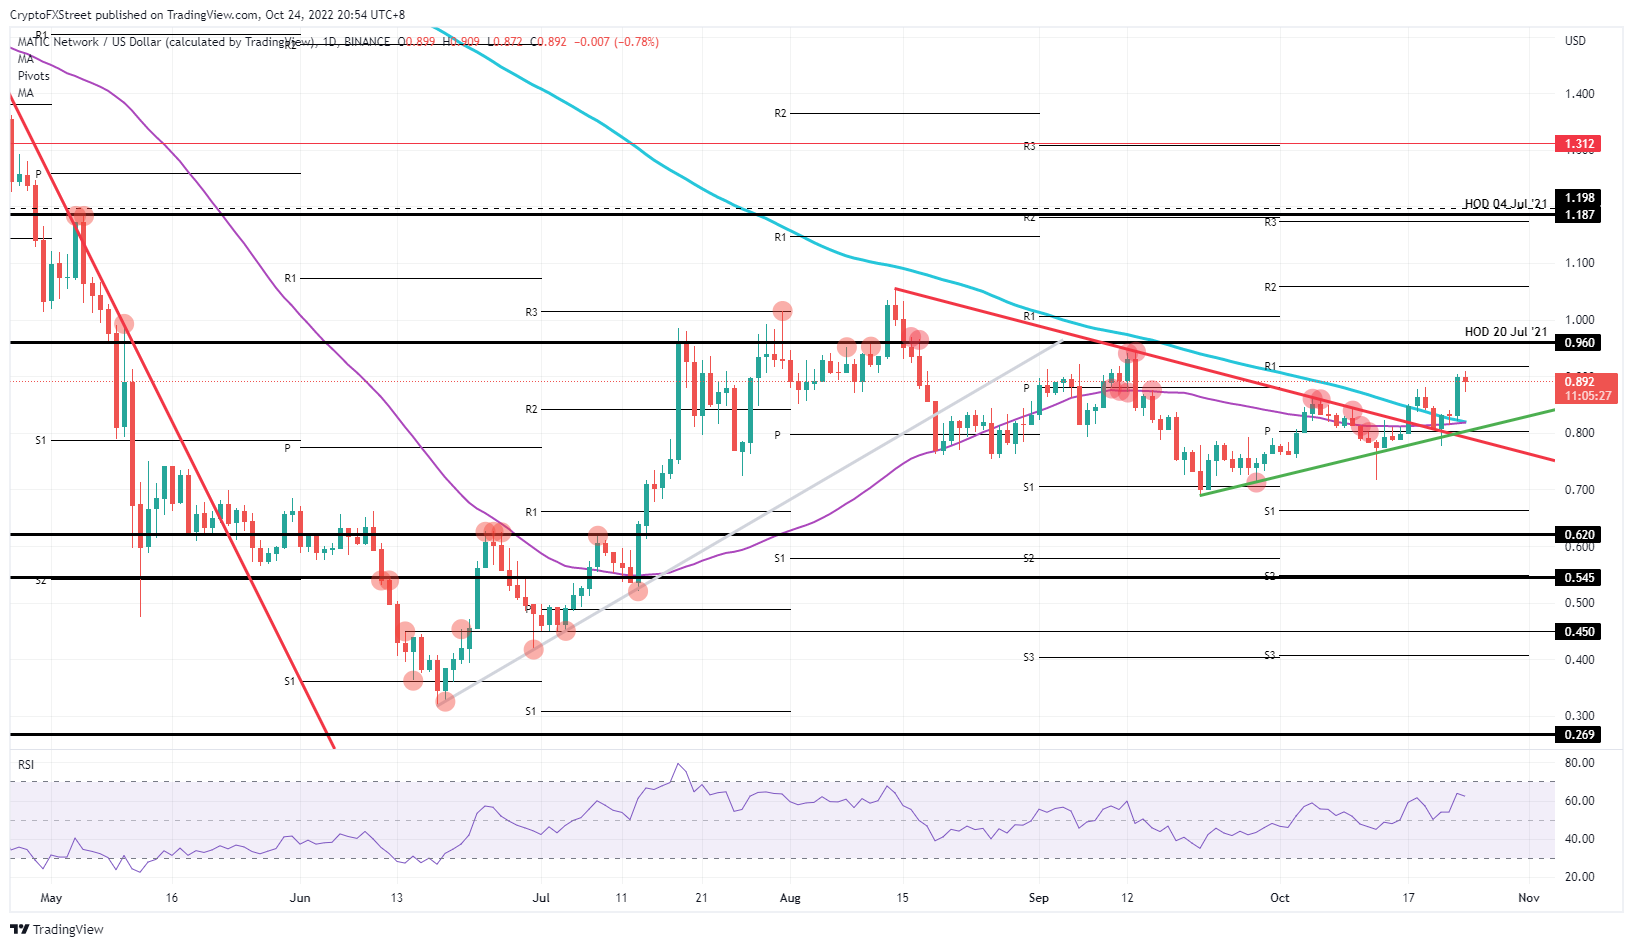
MATIC/USD Daily chart
Of course, there is still a risk price could fall and the 55-day SMA trade near to but not quite succeed in crossing above the 200-day SMA. That would probably result in bulls pulling their funds from Sunday to book small quick gains. In such a situation, price action would collapse and drop back to $0.62 as the green trend line would break to the downside.
Author

Filip Lagaart
FXStreet
Filip Lagaart is a former sales/trader with over 15 years of financial markets expertise under its belt.


