MATIC Price Analysis: Polygon hints at minor retracement before resuming rally to $2
- MATIC price strikes resistance at the 50 twelve-hour simple moving average (SMA), hinting at retracement in the short term.
- Polygon volume during the 48% bounce off the June 11 low has not printed above-average daily readings.
- Despite the bounce, the Santiment 30-day MVRV ratio indicates that the digital asset is still undervalued.

MATIC price awoke and dismantled May’s declining trend line on June 13 with a 7.5% gain. Polygon continued the bounce into the 50 twelve-hour SMA before correcting the last couple of days. The breakout above the trend line has invigorated the altcoin, and the current undervalued condition has raised the probability that it may renew its leadership position in the cryptocurrency complex.
MATIC price decouples from the market, maintained by a positive fundamental story
MATIC price jumped over 47% over four days before stumbling at the 50 twelve-hour SMA. Volume increased during the streak, but it did not match the robust volume that accompanied the rebound off the May 23 low, suggesting a lingering reluctance to enter the market aggressively.
The blunt reaction at the 50 twelve-hour SMA indicates that MATIC price could enter a retracement phase with the potential to drop near May’s declining trend line, resulting in a 20% drop from the June 15 high. It is anticipated that Polygon investors will capitalize on the weakness and resulting undervaluation to initiate or increase positions with the projection of a new all-time high in the coming months.
If the bullish narrative endures a retracement, Polygon speculators should visualize resistance at the merger of the May 30 high of $1.98 and the psychologically important $2.00 before ascending to the May 26 high of $2.44, and finally the all-time high of $2.71.
It is important to note that the bullish outlook is not forecasting a relentless advance considering the listlessness in most altcoins. Instead, a measured, frequently interrupted rally is the more probable scenario.
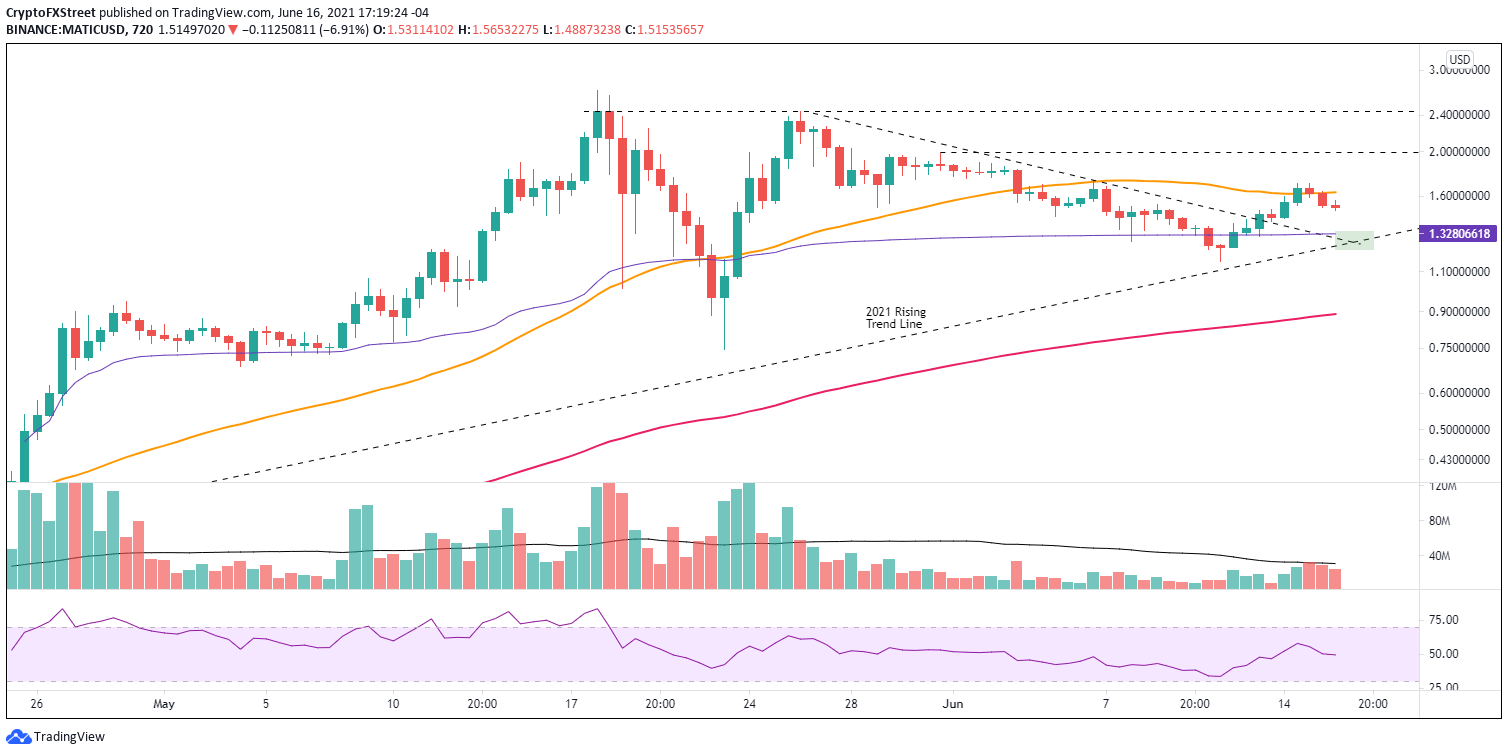
MATIC/USD 12-hour chart
Now, if the MATIC price retracement extends to the 2021 rising trend line, Polygon market operators need to become cautious. A decline below the June 11 low of $1.15 would not only confirm the end of the emerging rally but would also break the governing uptrend during this year, forcing a reevaluation of the larger bullish narrative for the Indian blockchain platform.
Supporting a positive outlook for MATIC price is the Santiment Market Value to Realized Value (MVRV) metric. The MVRV distinguishes between overvalued and undervalued conditions. Negative values confirm an undervalued market, and positive readings are associated with varying levels of overvaluation.
At the May low, the Polygon MVRV tagged the lowest reading since September 2020 at -26.31%. The MVRV metric has rebounded with MATIC price. However, it remains decidedly negative, confirming an undervalued market and supporting the view that the cryptocurrency still has significant room to rally before heavy selling pressure can be expected.
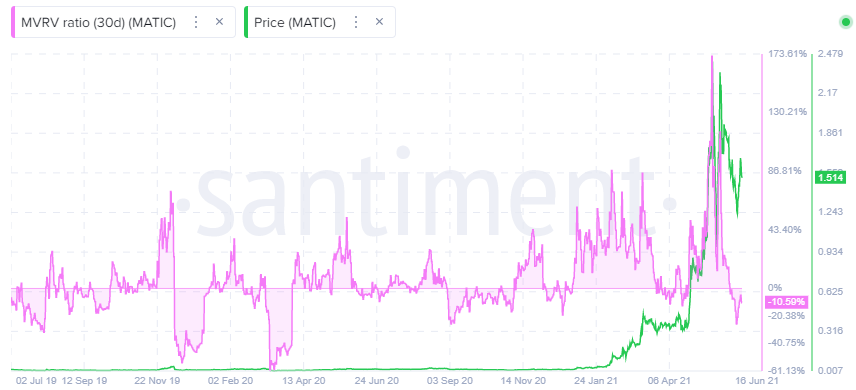
MATIC MVRV ratio - Santiment
Polygon is receiving an increase in attention for its answer to some of the challenges confronted by the Ethereum blockchain, such as heavy fees, poor user experience and low transactions per minute. It is involved with the timeliest areas of cryptocurrencies, including DeFi, DApps, DAO’s and NFT’s.
The Polygon story is exciting and positions MATIC price for higher levels moving forward.
Author

Sheldon McIntyre, CMT
Independent Analyst
Sheldon has 24 years of investment experience holding various positions in companies based in the United States and Chile. His core competencies include BRIC and G-10 equity markets, swing and position trading and technical analysis.


